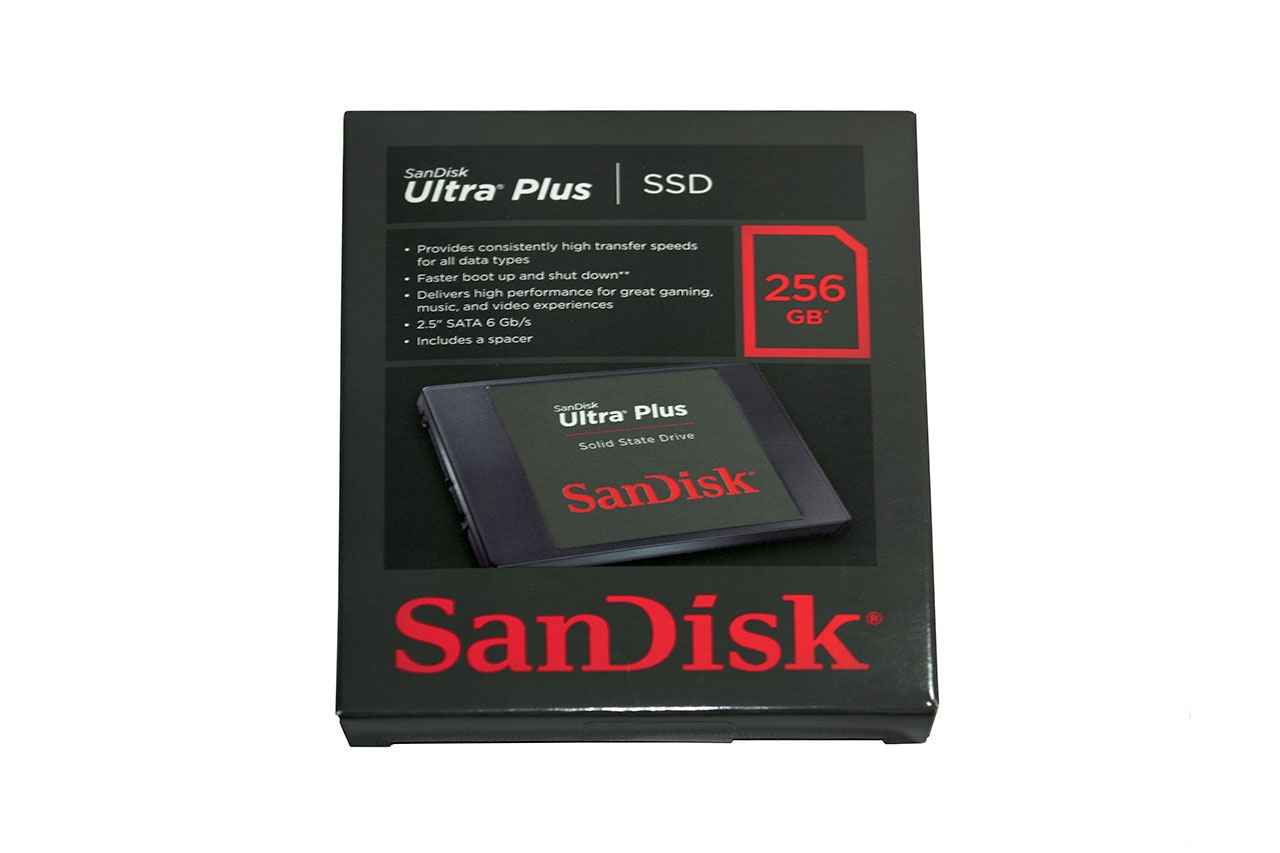
SanDisk Ultra Plus 256GB SSD Review
Don’t like the speed you get with your regular HDD? Thinking of getting an SSD? You can consider this one. Read on to find whether this fits your performance criteria.
On opening the SSD enclosure we found a quarter profile PCB housing the SSD components. It sports a Marvell 88SS9175, a four-channel controller. Thanks to the four channel controller, there are only four NAND chips (4x64GB 19nm SanDisk eX2 ABL). Apart from this, there is a Samsung DDR2-800 caching DRAM onto which data is temporarily cached before finally moving to and from the NAND chips. The NAND chips have a special feature called nCache which makes part of the eX2 ABL multilevel-cell (MLC) NAND act as non-volatile single-level cell (SLC) NAND called as nCache. Generally in an SSD, as the incompressible file size goes below 1MB, the performance does tend to take a hit. In order to prevent smaller sized incompressible data from populating the MLC NAND, it is housed in the nCache. The nCache being non-volatile in nature, has a lifespan which is 10 times that of MLC NAND. Thus nCache tends to increase the overall endurance of the SSD while optimizing performance during incompressible data writes.
We used a mix of synthetic and real world tests to test the performance of the SanDisk Ultra Plus 256GB. But before testing we made sure to securely erase it using DiskWipe software utility and used the One Pass Zeroes erasing pattern to write zeroes on the SSD. This ensures that the SSD is free of any content. Our first synthetic test was Crystal Disk Mark and we kept the test size as 1000MB for both random read/write tests while running five iterations of the test.
These are the scores received using Crystal Disk Mark (0x00 Fill):
Read (in MB/s)
Sequential/512K: 507/316.9
4K QD32: 267.5
Write (in MB/s)
Sequential/512K: 447.8/401.4
4K QD32: 190.4
Next we used AS SSD benchmark to get the sequential and random read/write scores. The file size we used in the random test was 4KB. We also received the access time from the AS SSD benchmark.
These are the scores we received in AS SSD benchmark:
Read:
Sequential Read (in MB/s): 488.6
4K 64 (in MB/s): 308.51
Access Time (in ms): 0.07
Write:
Sequential Write (in MB/s): 438.27
4K 64 (in MB/s): 163.8
Access Time (in ms): 0.08
Overall Score: 849
IOPS
Read 4K-64 Thread: 78979
Write 4K-64 Thread: 41932
AS SSD Copy Benchmark:
Speed (in MB/s)
ISO: 301.27
Program: 201.44
Game: 212.95
Duration (in secs)
ISO: 3.56
Program: 6.98
Game: 6.49
Synthetic tests didn’t end here as we also ran PC Mark 7’s secondary storage test. Below are the scores that we received using PC Mark 7:
PC Mark Secondary Storage Score: 5276
Windows Defender (MB/s): 5.59
Importing Pictures (MB/s): 26.93
Video Editing (MB/s): 23.16
Windows Media Centre (MB/s): 8.27
Adding Music (MB/s): 1.41
Starting applications (MB/s): 55.12
Gaming (MB/s): 16.75
Finally, we did the real world tests as these tests are a true indication of how good is the performance of any particular SSD. We used a single 8GB sequential file for sequential read and write tests. And an assorted set of files of size 8GB for assorted read and write tests.
Real world test results:
8 GB Sequential File Write: 346.68
8 GB Assorted File Write: 234.66
8 GB Sequential File Read: 334.64
8 GB Assorted File Read: 235.67
Sequential Transfer: 174.37
Assorted Transfer: 109.23
Speaking about raw overall performance, the SanDisk Ultra Plus did really well and is from among the few SSD’s we’ve tested that crosses the 300 MB/s mark in sequential write tests. At an impressive cost per GB price of Rs.54.51, the Ultra Plus 256GB is an good SSD to go for considering its performance is good too.
Features:
TRIM Support: Yes;
Unformatted Space: 238.47
SSD Controller: Marvell 88SS9175
NAND Process (in nm): 19

