Sapphire Pulse Radeon RX 7900 GRE Gaming OC 16GB Graphics Card Review
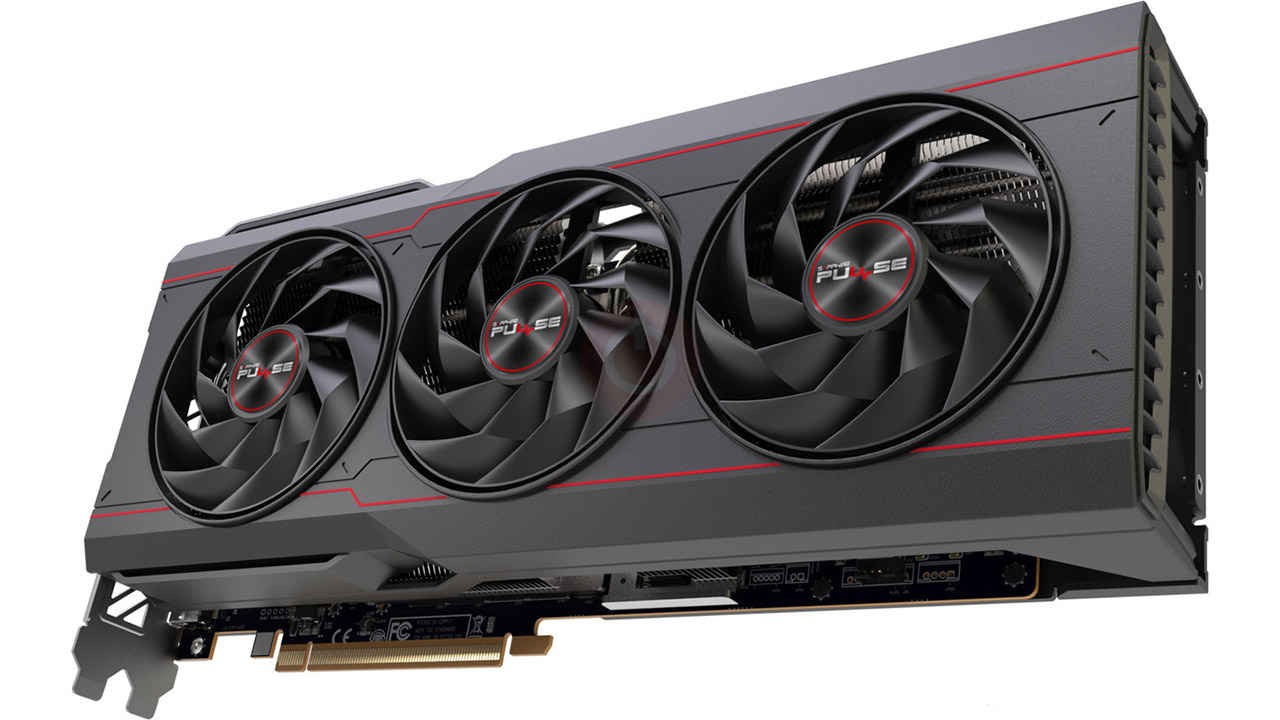
- Performs better than 6800 XT
- In line with 4070 Super
- Silent cooling and low temps
- Memory and Core clocks lower than expected
- Triple-slot card
The Sapphire Radeon RX 7900 GRE is a good graphics card for gaming at 1440p with plenty of performance headroom for a few years. It does better than the RX 6800 XT from the previous generation and goes toe-to-toe with the RTX 4070 Super. We don’t have the official Indian pricing for the 7900 GRE but we did spot some listings for INR 70,500 which seems a little higher considering that the RTX 4070 Super, which is as good in raster gaming and better in ray tracing-enabled gaming, costs INR 63,000. To be cost-effective, that’s the max that this card should sell for to be a great 1440p gaming graphics card.
An exclusive to the Mainland China market until now, the AMD Radeon RX 7900 GRE (Golden Rabbit Edition) is a slightly scaled down version of the 7900 made to celebrate the year of the Rabbit – 2023. Well, it’s no longer the year of the rabbit and the card is no longer an exclusive as AMD has now launched it globally. There is no vanilla Radeon RX 7900 so the GRE isn’t a new term that AMD is going to be using across the stack like the XT or XTX suffixes that it has. For all intents and purposes, think of this as the RX 7900 that should have launched along with the other top-end cards.
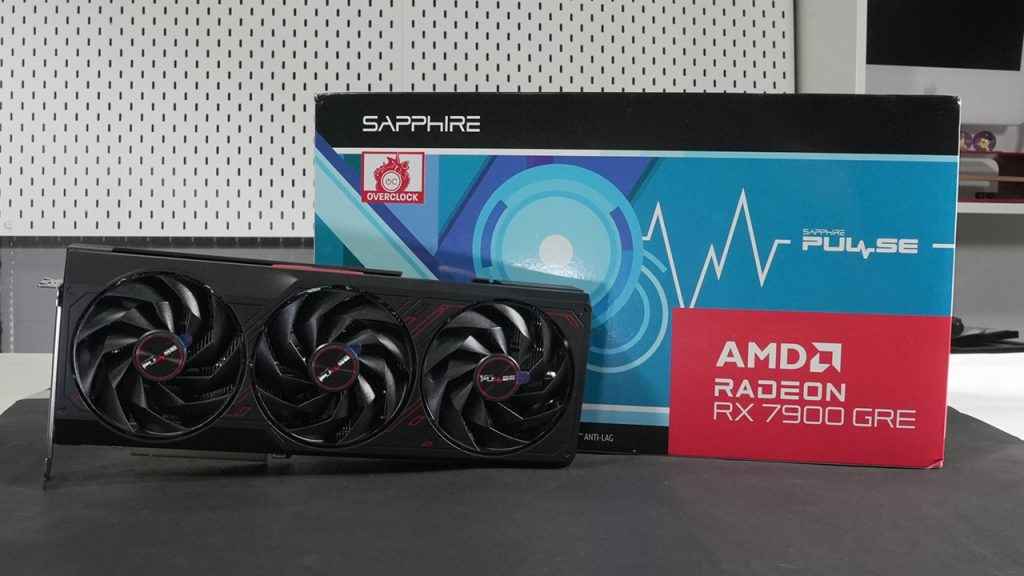
The AMD Radeon RX 7900 GRE serves as the middle ground between the RX 7800 XT and the RX 7900 XT. And you might be wondering why AMD is releasing a card that has already been released? Well, since NVIDIA has been rather busy padding its roster with cheaper cards, it was only natural for AMD to also put a few cards out. Which also begs the question, is this too little and too late? Let’s find out.
AMD Radeon RX 7900 GRE Specifications
The AMD Radeon RX 7900 GRE is based on the Navi 31 GPU which is the same that powers the Radeon RX 7900 XTX and the XT. The only difference is the number of active Dual Compute Units within the Shader Engines. Navi 31 has a total of six Shader Engines which can host up to 6144 Shaders and the GPU that sits on the 7900 GRE is a slightly cut down version of that. We don’t know if it has five or six active Shader Engines since the 40 Dual Compute Units can fit in either configuration. The 7900 GRE has a total of 80 Compute Units or 5120 Shaders which churn out 45.98 TFLOPs of performance at peak clock speeds. And since each Compute Unit hosts one Ray Tracing core, we have a total of 80 Ray Tracing cores. The other components such as the Render Output Units (ROP) and Texture Units are proportional i.e. 192 and 320, respectively.
| AMD Radeon RX 7900 GRE Specifications | ||||
| RX 7900 XTX | RX 7900 XT | RX 7900 GRE | RX 7800 XT | |
| Code Name | Navi 31 XTX | Navi 31 XT | Navi 31 | Navi 32 XT |
| Shader Engines | 6 | 6 | 5/6 | 4 |
| Dual Compute Units | 48 | 42 | 40 | 30 |
| Compute Units | 96 | 84 | 80 | 60 |
| Shaders | 6144 | 5376 | 5120 | 3840 |
| Shader FLOPS | 61.44 | 51.61 | 45.98 | 37.32 |
| Tensor Cores | 0 | 0 | 0 | 0 |
| AI TOPS | 0 | 0 | 0 | 0 |
| RT Cores | 96 | 84 | 80 | 60 |
| Texture Units | 384 | 336 | 320 | 240 |
| ROP Units | 192 | 192 | 192 | 96 |
| Base Clock | 1855 MHz | 1500 MHz | 1287 MHz | 1295 MHz |
| Boost Clock | 2499 MHz | 2394 MHz | 2245 MHz | 2439 MHz |
| Memory Clock | 2500 MHz | 2500 MHz | 2250 MHz | 2438 MHz |
| Memory Data Rate | 20 GB/s | 20 GB/s | 18 GB/s | 19.5 GB/s |
| L0 Data per WGP | 64 KB | 64 KB | 64 KB | 32 KB |
| L1 Cache per Array | 256 KB | 256 KB | 256 KB | 128 KB |
| L2 Cache Size | 6 MB | 6 MB | 6 MB | 4 MB |
| L3 Cache Size | 96 MB | 80 MB | 64 MB | 64 MB |
| Total Video Memory | 24 GB | 20 GB | 16 GB | 16 GB |
| Video Memory Type | GDDR6 | GDDR6 | GDDR6 | GDDR6 |
| Memory Interface | 384-bit | 320-bit | 256-bit | 256-bit |
| Total Memory Bandwidth | 960.0 GB/s | 800.0 GB/s | 576.0 GB/s | 624.1 GB/s |
| Process Node | TSMC N5 / N6 | TSMC N5 / N6 | TSMC N5 / N6 | TSMC N5 / N6 |
| Total Graphics Power | 355 W | 300 W | 260 W | 263 W |
Coming to the memory configuration, the AMD Radeon RX 7900 GRE has a similar configuration as the RX 7800 XT. So it has 16 GB of GDDR6 memory chips connected to a 256-bit wide memory bus. The memory clock is at 2250 MHz which is a bit lower than the RX 7800 XT. So peak memory data rate is 18 GBps as opposed to the 19.5 GBps bandwidth available on the 7800 XT. And the clock speeds are also a little lower at 2245 MHz boost clock as opposed to the 2438 MHz that the 7800 XT is at. More shader cores running at higher clock speeds can often consume a lot of power so this is absolutely normal. Until you see the clock speeds on the 7900 XT or XTX which are clocked at 2394 MHz and 2499 MHz despite having way higher shader cores.
Essentially, the AMD Radeon RX 7900 GRE has fewer cores which ideally could have been clocked higher but hasn’t been. And it has slower memory than all the cards in its vicinity which is also a step back. All of this leads to about 40 Watts of power savings, if at all that was the end goal. It seems like there is a lot of potential in this card that cannot be leveraged or will not be leveraged. All of that is totally fine if this is priced right and performs competitively. So, let’s see how it fares in that department.
Performance – Radeon RX 7900 GRE
The card is being compared against only the recently re-tested graphics cards and not any of the older graphics cards that are no longer available with us. Here’s the rig it was tested on.
TEST RIG
Processor – Intel Core i9-14900K
CPU Cooler – AORUS WATERFORCE X II 360
Motherboard – GIGABYTE Z790 AORUS MASTER X
RAM – 2x 16 GB Kingston Renegade FURY 6000 MT/s (Set to 5200 MT/s)
SSD – Lexar NM760 1 TB NVMe SSD
PSU – Cooler Master MWE 850 V2 Gold
3DMark Fire Strike Ultra
3DMark Fire Strike is an intensive DirectX 11 synthetic benchmark designed to test the performance of graphics cards and the ‘Ultra’ setting runs the benchmark at 4K UHD resolution. It stresses the GPU through complex scenes, highlighting its capability to handle high-resolution gaming, shader processing, tessellation, and particle effects, thereby showcasing overall graphics rendering strength and stability.
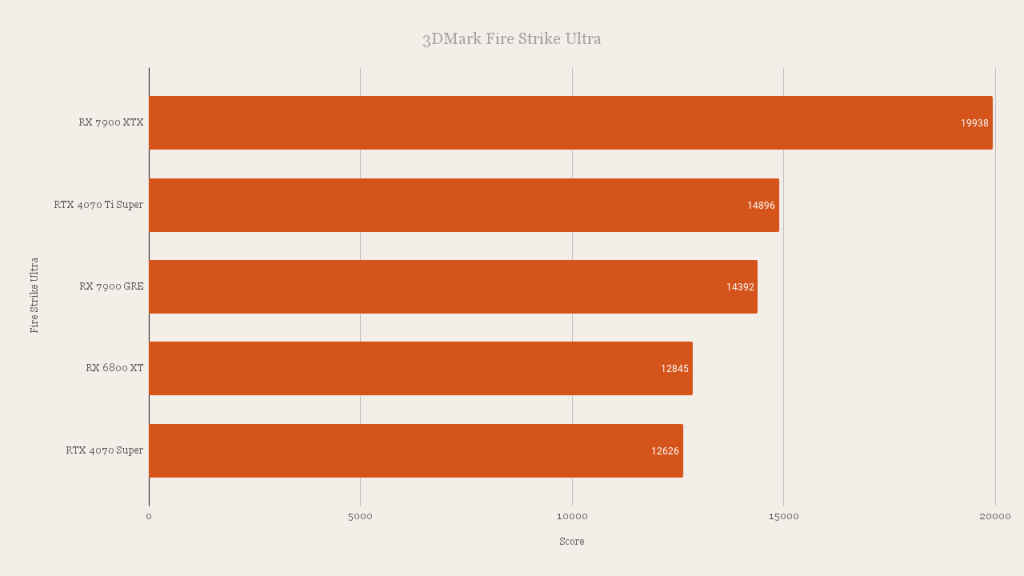
3DMark Speed Way
3DMark Speed Way is a benchmark designed to evaluate the performance of graphics cards using the DirectX 12 Ultimate API. It focuses on features like ray tracing, mesh shading, and variable rate shading, testing a GPU’s ability to manage advanced lighting, detailed scenes, and efficient rendering techniques for future-proof gaming experiences.
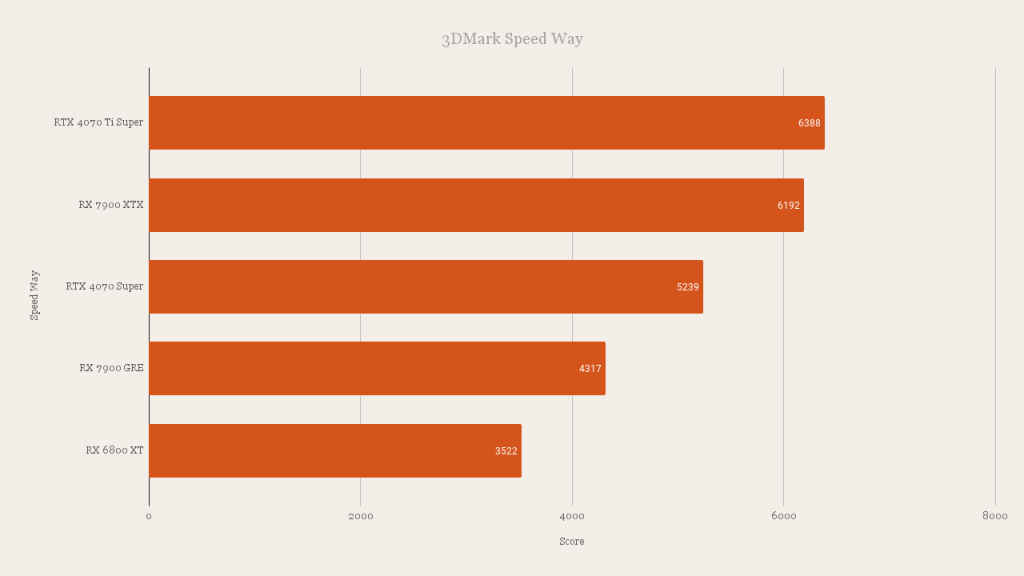
3DMark Time Spy
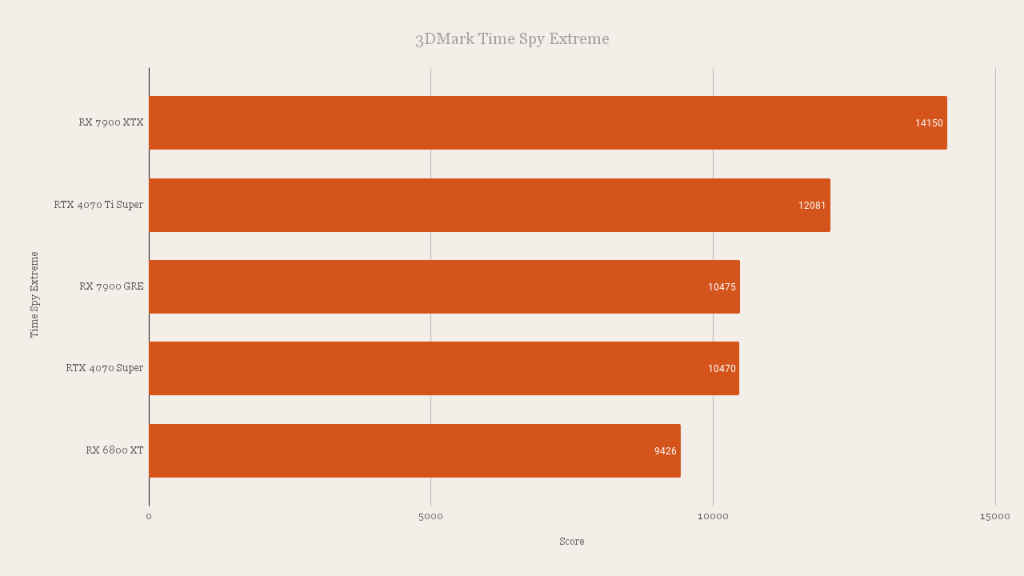
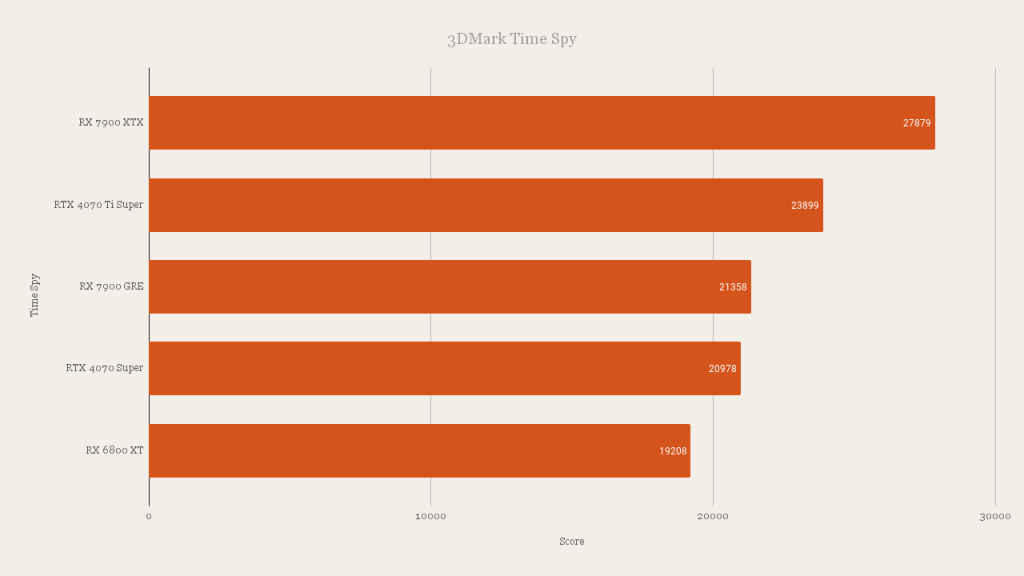
3DMark Time Spy is yet another of UL Benchmarks that assesses graphics card performance using the DirectX 12 API, targeting Windows 10 gaming PCs. It evaluates GPU capabilities in handling complex geometries, global illumination effects, and asynchronous compute operations, focusing on rendering efficiency, detail, and overall visual fidelity in modern gaming environments.
3DMark Port Royal
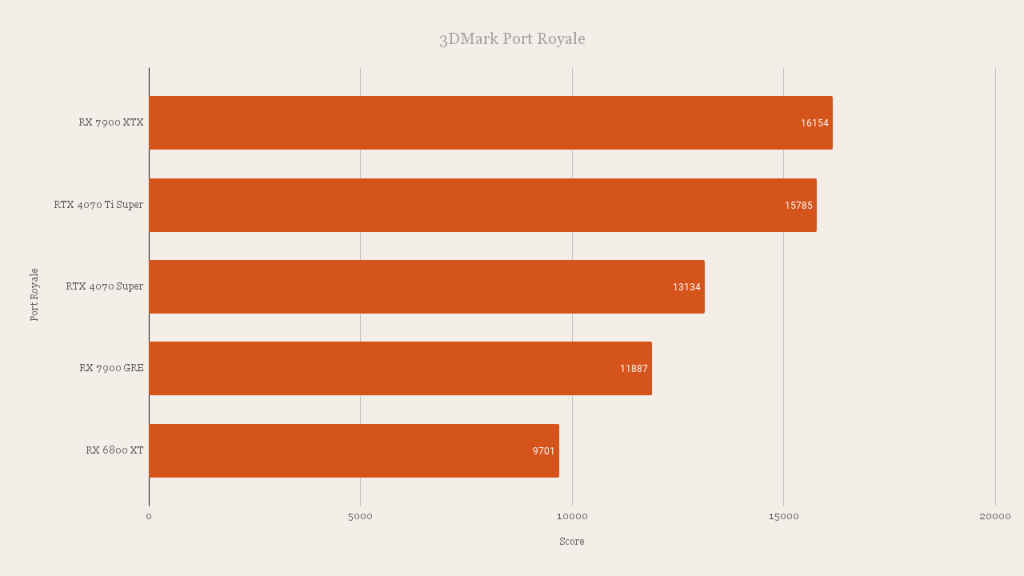
With ray tracing on the rise in video games, we had to include 3DMark Port Royal which is a synthetic benchmark that evaluates the performance of graphics cards in real-time ray tracing. Utilising the DirectX Raytracing (DXR) API, it focuses on a GPU’s capability to manage complex light interactions and reflections, testing the hardware’s readiness for next-generation gaming visuals that require intensive computational power for realistic lighting effects.
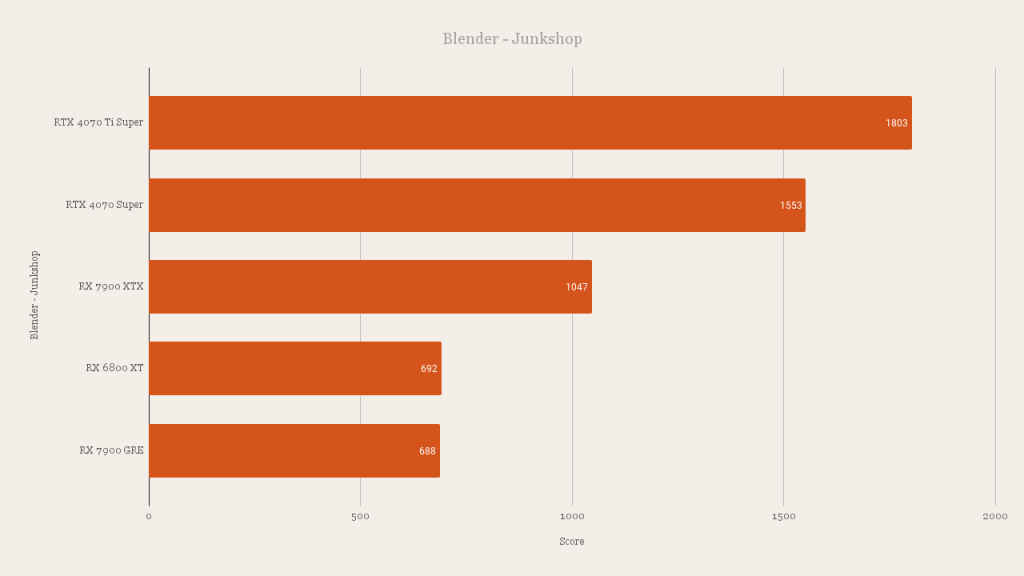
Blender Benchmark
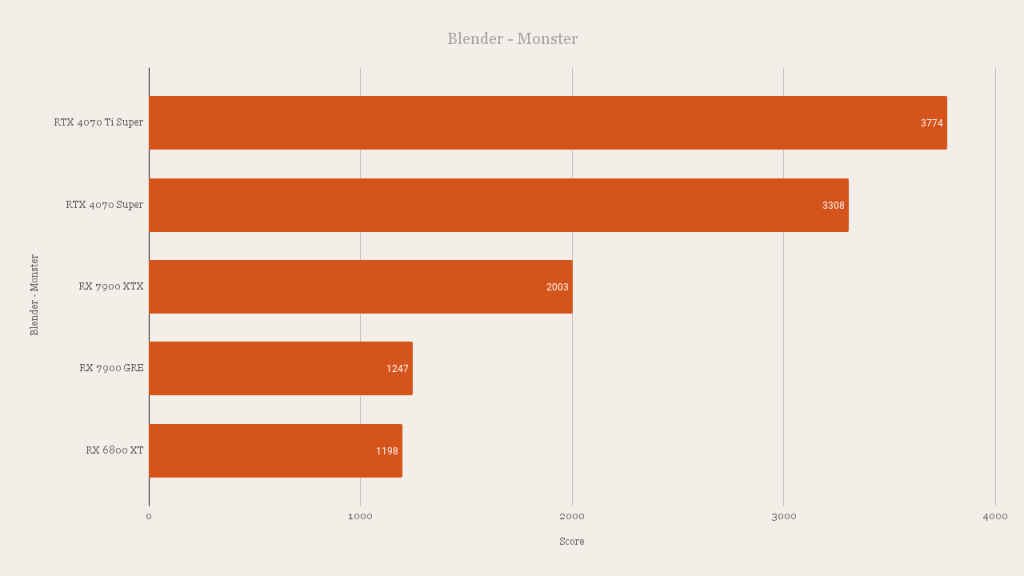
The Blender Benchmark tests graphics card performance in 3D rendering using the Blender software, primarily focusing on the Cycles rendering engine. It doesn’t rely on a specific API like DirectX or Vulkan but evaluates GPU rendering capabilities. Scenes like Junkshop, Monster, and Classroom are used to assess performance across different complexities and lighting conditions. Junkshop tests material and texture handling, Monster evaluates the GPU’s ability to process complex geometries and volumetrics, while Classroom examines detailed lighting and shadow rendering, offering a comprehensive view of a GPU’s rendering strength across varied 3D tasks.
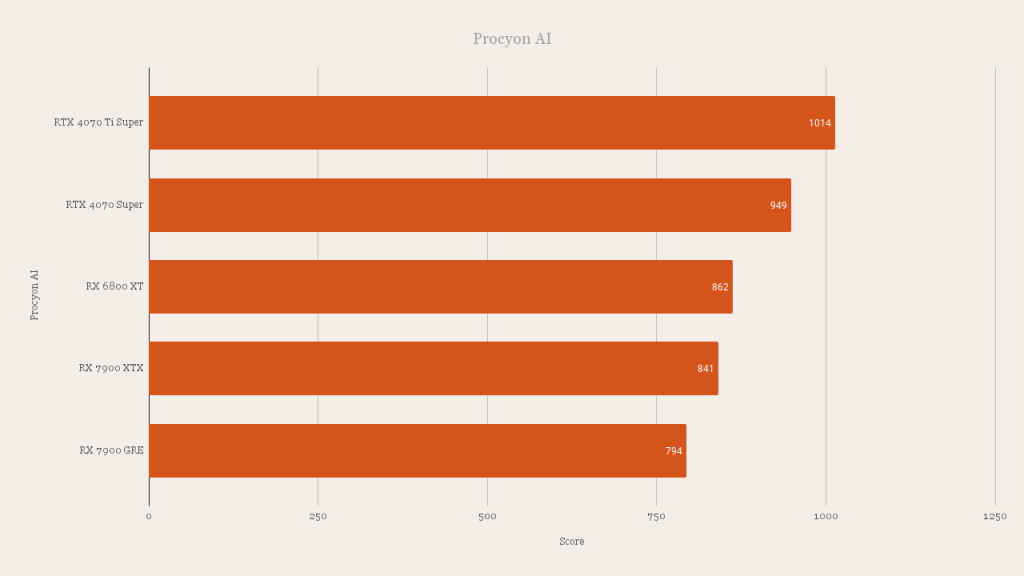
Procyon AI Inferencing
The Procyon AI Inferencing Benchmark measures a graphics card’s performance in AI-driven tasks, focusing on aspects like model inference speed and efficiency. It uses APIs relevant to machine learning, such as CUDA for NVIDIA GPUs, to evaluate how well a GPU can handle AI computations, reflecting its capability in AI applications and workloads.
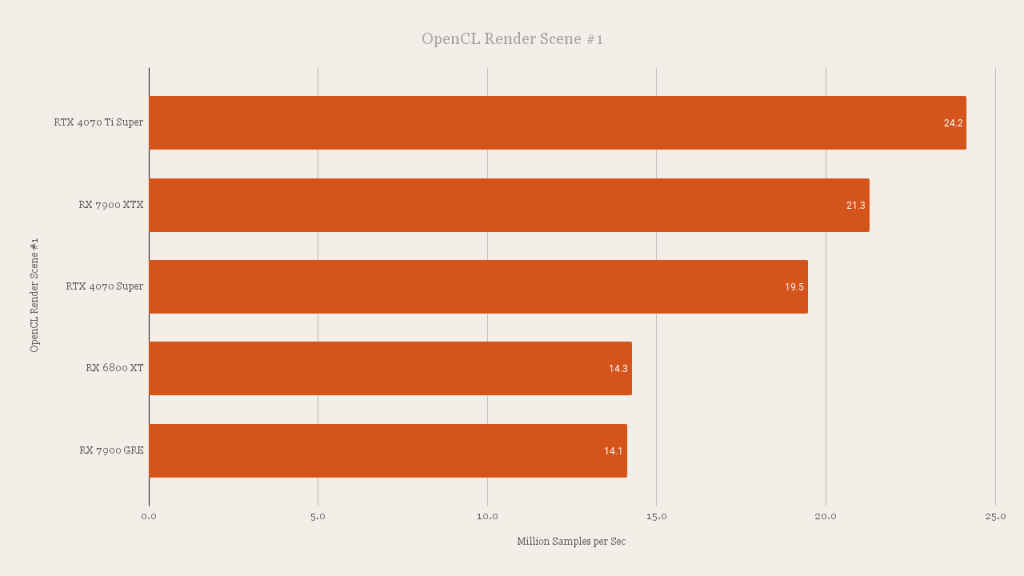
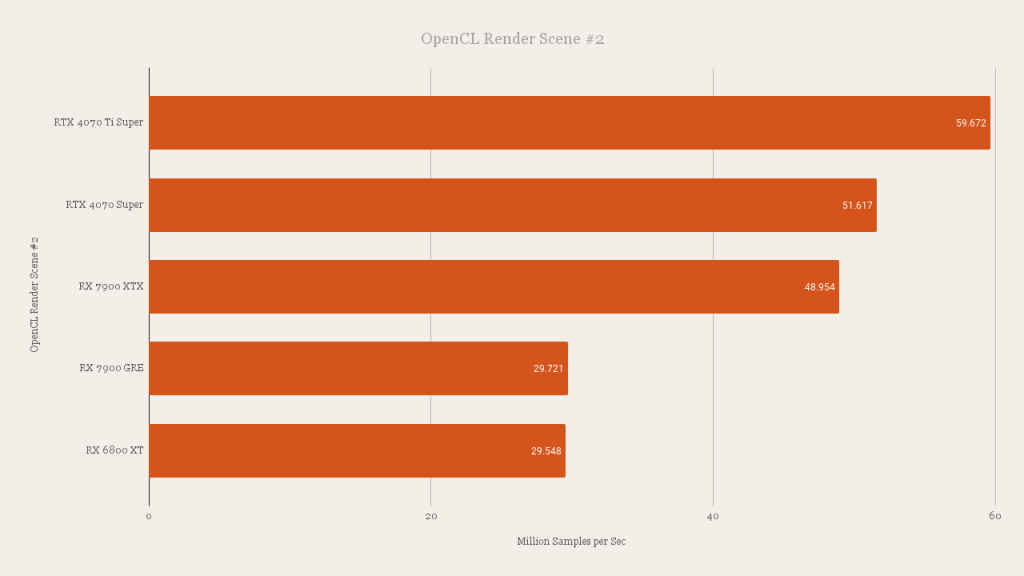
IndigoBench
IndigoBench is a benchmarking tool from Indigo Renderer that tests graphics card performance through OpenCL. It evaluates a GPU’s efficiency in rendering photorealistic images, focusing on computational speed and accuracy in handling complex lighting, material properties, and scene geometries. By leveraging OpenCL, IndigoBench offers a comparative performance analysis, showcasing how different GPUs handle intensive rendering tasks across various hardware architectures.
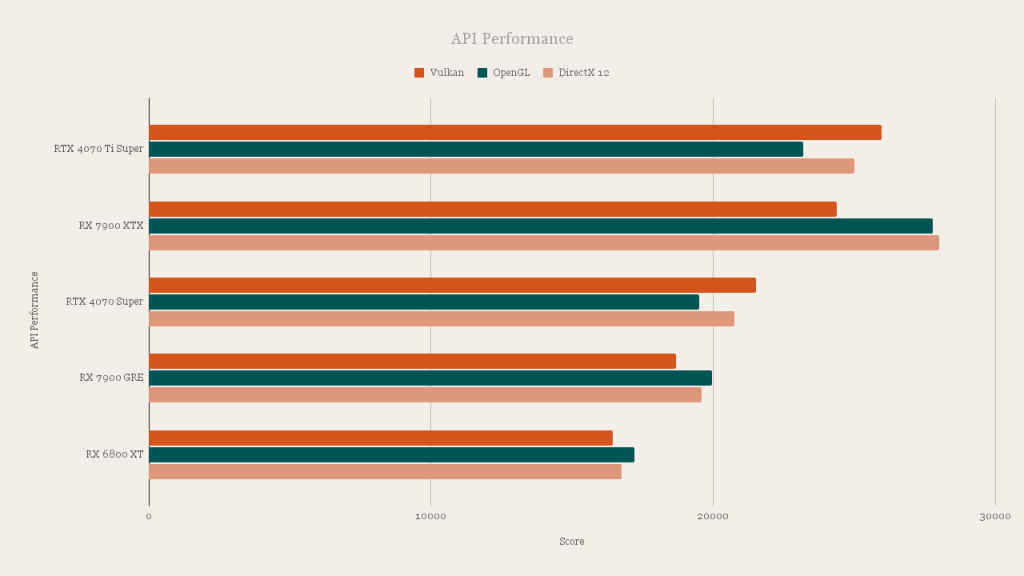
API Performance
Basemark GPU is a cross-platform benchmark that assesses graphics card performance across different workloads, including gaming and visual content creation. It uses DirectX, OpenGL, and Vulkan APIs to provide a comparative analysis of a GPU’s efficiency and capability in handling various graphical demands. This approach allows for a comprehensive evaluation across diverse API environments, showcasing how well a graphics card performs under different graphical standards and workloads.
Gaming performance – Radeon RX 7900 GRE
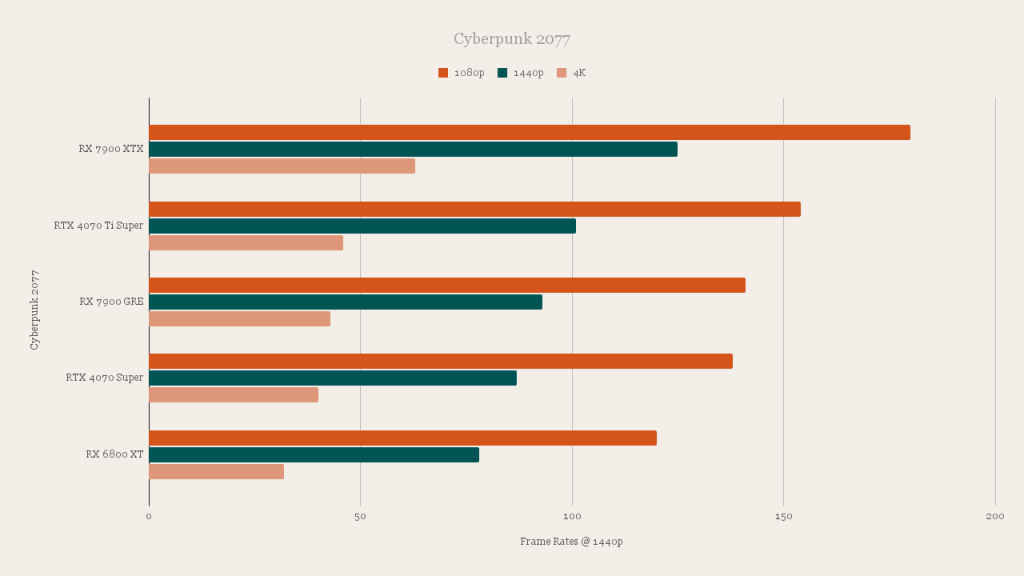
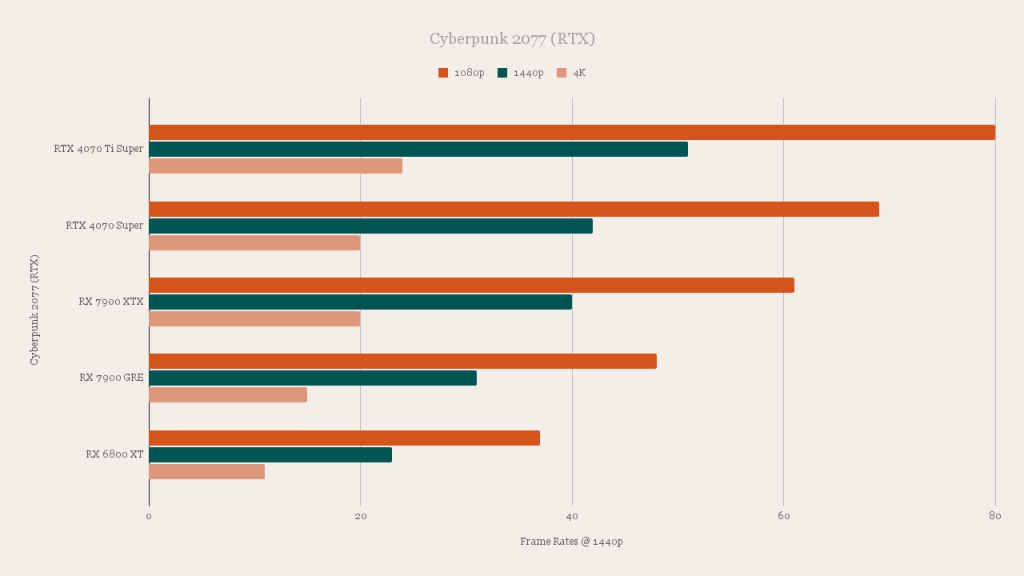
Cyberpunk 2077
The built-in benchmark within Cyberpunk 2077, an open-world RPG set in a dystopian future, tests graphics card performance in both rasterization and ray tracing. It evaluates how well a GPU handles the game’s demanding urban environments, complex lighting, and detailed textures using DirectX 12 and Vulkan APIs. This benchmark provides insights into a graphics card’s capability to render high-fidelity visuals and advanced lighting effects efficiently in a dynamic, open-world setting, offering a balanced assessment of raster performance as well as ray tracing prowess.
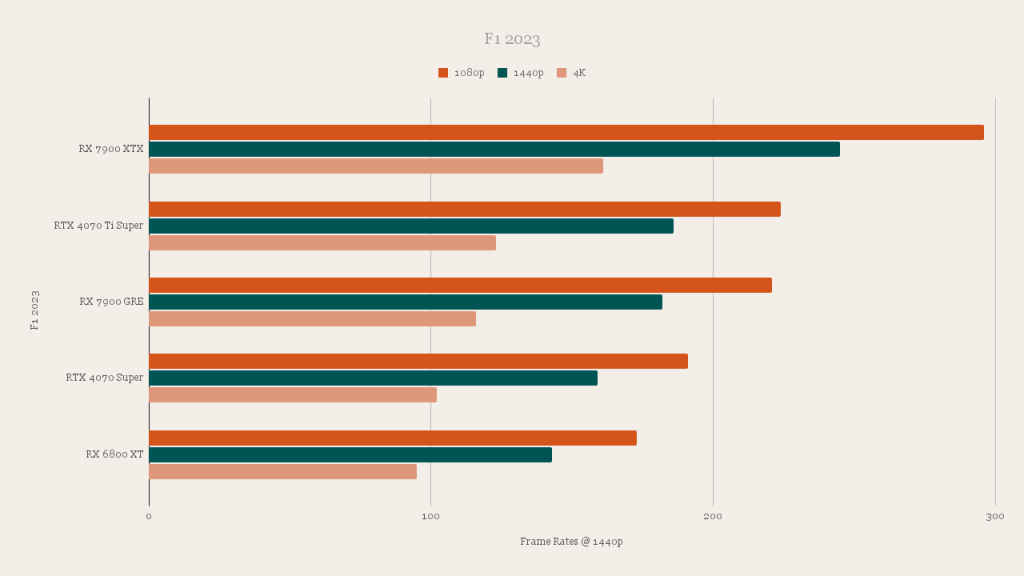
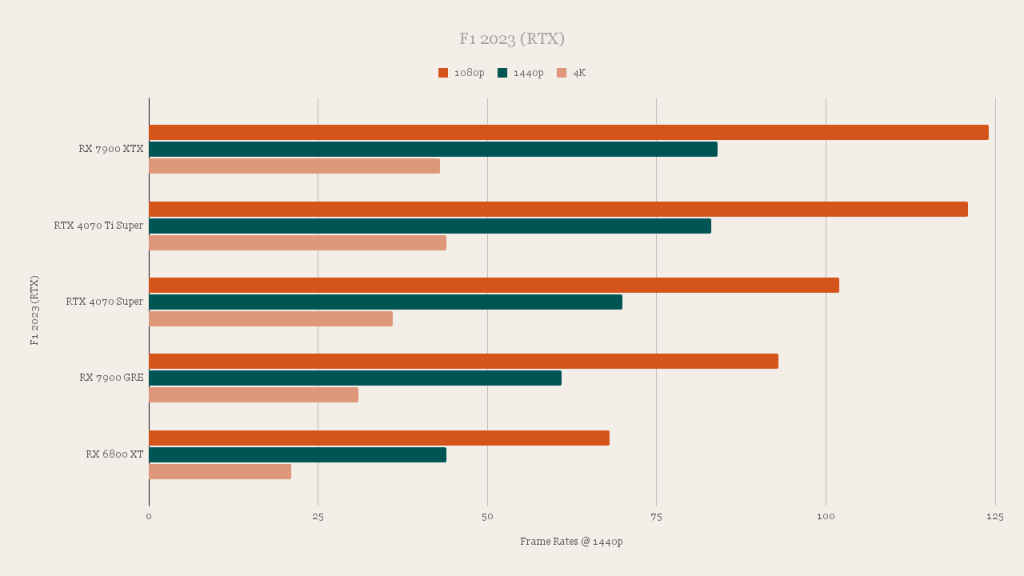
F1 23
The built-in benchmark within F1 2023, the latest installment in the high-speed, Formula One racing game series built on EGO Engine 4.0, tests graphics card performance on the Monaco track, focusing on rasterization and ray tracing capabilities. It leverages DirectX 12 to assess how well a GPU renders the game’s detailed vehicles, realistic environments, and advanced lighting effects. This benchmark specifically provides insights into the graphics card’s efficiency in delivering high-fidelity visuals and smooth performance in a competitive racing context, highlighting both traditional rendering and cutting-edge ray tracing techniques.
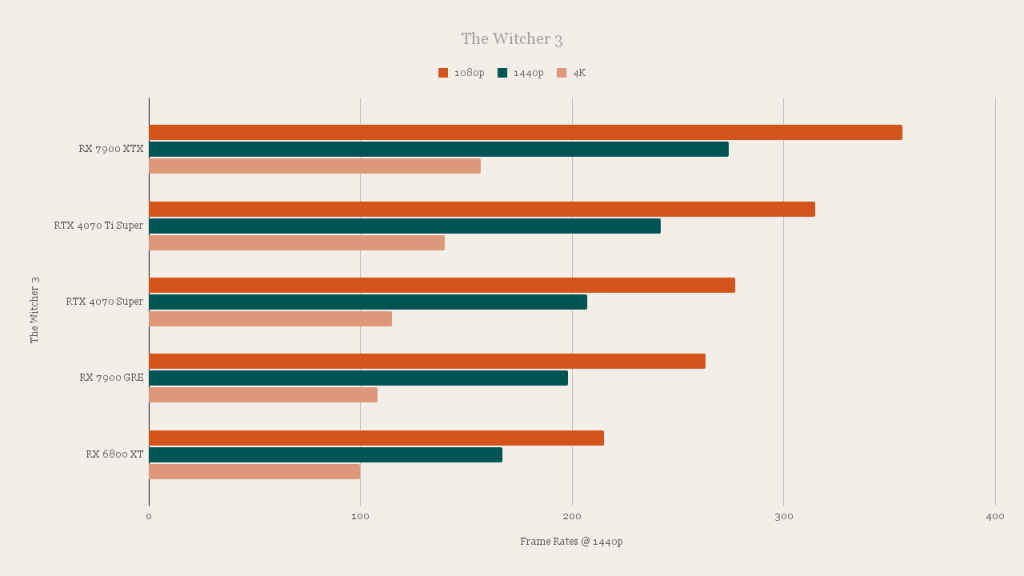
The Witcher 3: Wild Hunt
The Witcher 3: Wild Hunt, an expansive open-world RPG set in a gritty fantasy universe built on REDengine 3, does not officially include a built-in benchmark tool for testing graphics card performance. Typically, performance assessments focus on rasterization, as the original release predates widespread ray tracing adoption. The benchmark run follows a custom path cutting across several game scenes to evaluate GPU performance. We run the benchmark in DirectX 11 mode for a legacy comparison metric across generations of GPUs.
Far Cry 6
Far Cry 6, a first-person shooter set in the fictional Caribbean dictatorship of Yara, includes a built-in benchmark that tests graphics card performance focusing on both rasterization and ray tracing capabilities. Utilizing the DirectX 12 API, it evaluates how well a GPU renders the game’s lush landscapes, complex physics, and detailed character models. This benchmark thoroughly assesses a graphics card’s ability to deliver high-fidelity visuals and advanced lighting effects in a rich, open-world environment.
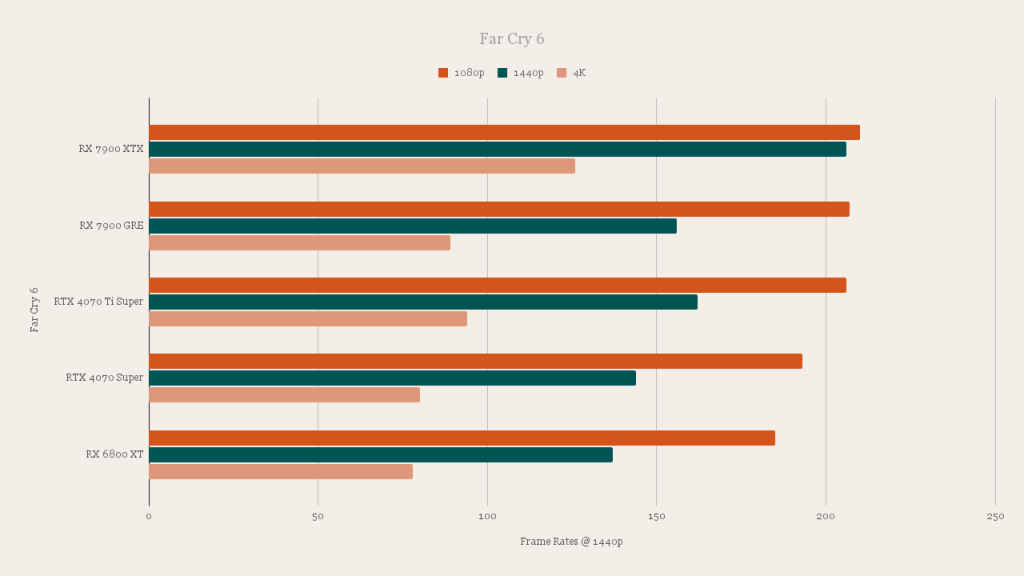
Compared to the RX 6800 XT, the 7900 GRE is a minor improvement over the 6800 XT. We did not have a 7800 XT to compare the card against, so we can’t tell you how much of a performance difference there exists between them. We have the scores for the 7900 XTX, which is about 43 per cent ahead in synthetic benchmarks. And compared to the 6800 XT, it is about 22 per cent ahead. In gaming, the 7900 GRE is about 4.5-5 per cent ahead of the 6800 XT. And compared to the recently launched RTX 40-series Super cards, the AMD Radeon RX 7900 GRE goes toe-to-toe with the RTX 4070 Super but is usually lagging behind by a few FPS with ray tracing turned on. Without ray tracing, the 7900 GRE is the one ahead. But in the grand scheme of things with both raster and ray tracing performance considered, the 4070 Super gets a slight advantage.
Verdict – Radeon RX 7900 GRE
The Sapphire Radeon RX 7900 GRE is a good graphics card for gaming at 1440p with plenty of performance headroom for a few years. It does better than the RX 6800 XT from the previous generation and goes toe-to-toe with the RTX 4070 Super. We don’t have the official Indian pricing for the 7900 GRE but we did spot some listings for INR 70,500 which seems a little higher considering that the RTX 4070 Super, which is as good in raster gaming and better in ray tracing-enabled gaming, costs INR 63,000. To be cost-effective, that’s the max that this card should sell for to be a great 1440p gaming graphics card.
Sapphire Pulse RX 7900 GRE Gaming OC 16GB Graphics Card Key Specs, Price and Launch Date
| Release Date: | |
| Market Status: | Launched |
Mithun Mohandas
Mithun Mohandas is an Indian technology journalist with 14 years of experience covering consumer technology. He is currently employed at Digit in the capacity of a Managing Editor. Mithun has a background in Computer Engineering and was an active member of the IEEE during his college days. He has a penchant for digging deep into unravelling what makes a device tick. If there's a transistor in it, Mithun's probably going to rip it apart till he finds it. At Digit, he covers processors, graphics cards, storage media, displays and networking devices aside from anything developer related. As an avid PC gamer, he prefers RTS and FPS titles, and can be quite competitive in a race to the finish line. He only gets consoles for the exclusives. He can be seen playing Valorant, World of Tanks, HITMAN and the occasional Age of Empires or being the voice behind hundreds of Digit videos. View Full Profile


