Tutorial: Intel IoT Gateway, Industrial Oil & Gas Pressure Sensor, and AWS IoT

In this use case tutorial we'll use an Intel® NUC and Intel® IoT Gateway Developer Hub to interface an industrial fluid/gas pressure sensor to AWS* IoT running in the Amazon Web Services* Cloud. The application software we'll develop will control the pressure sensor and continuously transmit pressure measurements to AWS IoT where the data will be stored, processed and evaluated in the cloud.
The pressure sensor is an Omega* PX409-USBH which is a high speed industrial pressure transducer with a USB interface. The sensor is available in a number of different sensing configurations and pressure ranges from vacuum to 5,000 PSI. For this tutorial we'll use model PX409-150GUSBH which is a gage pressure transducer with a measurement range of 0 to 150 PSI. It's designed to connect to piping using a ¼-18 NPT threaded pipe fitting.
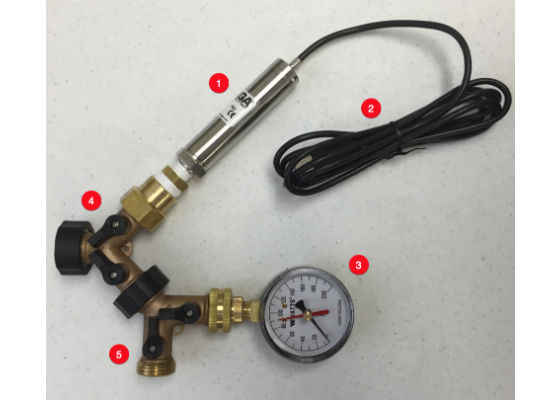
We'll connect the sensor to a pressurized water line with a secondary gauge for visual inspection of the pressure. Figure 1 shows the sensor configuration and fittings. (1) is the pressure sensor; (2) is the sensor USB cable that will connect to the Intel® NUC; (3) is a secondary gauge for comparison purposes; (4) and (5) are inlet and outlet connections along with control valves for changing the pressure.
Figure 1. The Omega PX409-USBH industrial pressure sensor
Setup Prerequisites
1. Intel® NUC powered up and connected to a LAN network with Internet access and a development laptop or workstation for logging into the Intel® NUC.
2. Intel® IoT Gateway Developer Hub running on the Intel® NUC and software updates applied.
3. Package "packagegroup-cloud-aws" installed on the Intel® NUC.
4. An active account on Amazon Web Services and familiarity with the AWS console, AWS IoT, and AWS Elasticsearch Service.
Connect Pressure Sensor to the Intel® NUC
1. Connect the pressure sensor USB cable into the USB port on the front of the Intel® NUC. After connecting the sensor the Intel® NUC will automatically assign a TTY device such as /dev/ttyUSB0 or /dev/ttyUSB1. The exact name will vary depending on whether you’ve connected other USB devices to the Intel® NUC.
2. Find the sensor’s device name by logging into the Intel® NUC over the LAN network using ssh. You’ll need to know the Intel® NUC’s IP address assigned on the LAN. For this example the IP address is 192.168.22.100 and the login name is gwuser and password gwuser.
ssh gwuser@192.168.22.100
gwuser@WR-IDP-9C99:~$ ls /dev/ttyUSB**
/dev/ttyUSB0
Here we see only one USB device which is named /dev/ttyUSB0 – that’s the pressure sensor. Next we’ll run some verifications tests to confirm the sensor is communicating with the Intel® NUC.
1. Use the screen utility to connect directly to the USB port and manually issue commands. The commands you type won’t be visible – only the results of the commands will display.
gwuser@WR-IDP-9C99:~$ sudo screen /dev/ttyUSB0 115200
2. Type in ENQ and hit Enter. You should receive a response that looks like this:
USBPX2
1.0.13.0826
0.0 to 150.0 PSI G
When you see this response it confirms that the pressure sensor is communicating with the Intel® NUC through the USB port. Exit screen by typing these commands: Control-A, Control-\, y.
Configure AWS* IoT and Node-RED*
Node-RED* is a visual tool for building Internet of Things applications. It’s pre-installed on the Intel®NUC as part of the Intel® IoT Gateway Developer Hub.
1. Log into your AWS account and navigate to the AWS IoT console.
2. Create a new device (thing) named Intel_NUC and a Policy named PubSubToAnyTopic that allows publishing and subscribing to any MQTT topic.
3. Create and activate a new Certificate and download the private key file, certificate file, and root CA file (available here) to your computer.
4. Attach the Intel_NUC device and PubSubToAnyTopic policy to the new certificate.
5. While logged into the Intel® NUC via ssh as gwuser, create the directory /home/gwuser/awsiot and then use SFTP or SCP to copy the downloaded private key file, certificate file and root CA files from your workstation to the /home/gwuser/awsiot directory on the Intel® NUC.
Create Node-RED* Sensor Flow
In the Intel® IoT Gateway Developer Hub click on the Sensors icon and then the Program Sensorsbutton. This will open the Node-RED canvas. If you get another login prompt use the same gwuser / gwuser login credentials you used when logging into the Intel® IoT Gateway Developer Hub.
You will see a default Node-RED flow for a RH-USB sensor. We’re not using that type of sensor here so you can either delete that flow or disable it by double-clicking the Interval node and settingRepeat to none followed by clicking Done. If you don’t delete the flow, select all the elements of the flow using the mouse and drag them down lower on the screen to open up more room at the top. Click the Deploy button to save and activate the changes.
First we’ll build a flow that continuously reads the pressure sensor and displays the pressure readings in the Intel® IoT Gateway Developer Hub. Follow these steps:
1. Drag the following types of nodes from the list on the left side onto the canvas and arrange them like shown in Figure 2: (1) inject (input), (2) function (function), (3) serial (output), (4) serial (input), (5)function (function), (6) chart tag (function), (7) mqtt (output).
2. A couple of the names will automatically change when you drop them on the canvas: inject will change to timestamp, and function will change to blank. Use the mouse to draw lines between the nodes so they look like Figure 2.
Figure 2. Initial Node-RED flow with nodes and connections
1. Next, double-click on each node corresponding to the numbered callouts and set the node parameters as shown in Figure 3. You may need to move the nodes around to maintain a clean layout.
2. For the serial nodes use the /dev/ttyUSBn device name corresponding to your pressure sensor (we're using /dev/ttyUSB0).
3. The serial port name and parameters are set by clicking the pencil icon next to Add new serial-port… and setting the values as shown in item 3A of Figure 3, then clicking Add.
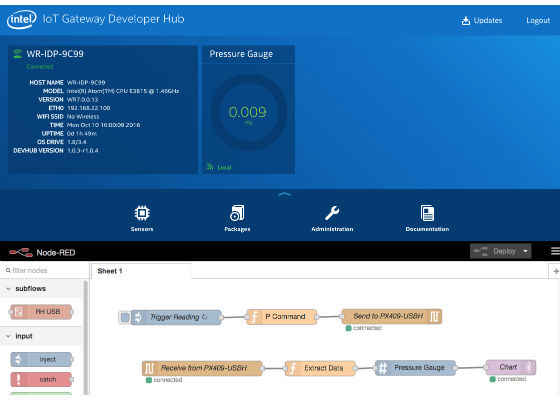
4. When you're done configuring the nodes the flow should look like Figure 4.
Figure 3. Node configuration details
Figure 4. Configured Node-RED flow and pressure data display
1. Click the Deploy button to deploy and activate the flow, then click your browser’s refresh button to refresh the entire web page. You should now see a live pressure gauge in the upper part of theIntel® IoT Gateway Hub as shown in Figure 4. You can apply water pressure to the sensor assembly and you’ll see the pressure readings increase and decrease as the pressure varies.
Connect Intel® NUC to AWS IoT
1. Drag a mqtt output node onto the Node-RED canvas and then double-click it.
2. In the Server pick list select Add new mqtt-broker… and then click the pencil icon to the right. In theConnection tab, set the Server field to your AWS IoT endpoint address which will look something like aaabbbcccddd.iot.us-east-1.amazonaws.com. You can find the endpoint address by using the AWS CLI command aws iot describe-endpoint on your workstation.
3. Set the Port to 8883 and checkmark Enable secure (SSL/TLS) connection, then click the pencil icon to the right of Add new tls-config…
4. In the Certificate field enter the full path and filename to your certificate file, private key file, and root CA file that you copied earlier into the /home/gwuser/awsiot directory. For example, the Certificate path might look like /home/gwuser/awsiot/1112223333-certificate.pem.crt and the Private Key path might look like /home/user/awsiot/1112223333-private.pem.key. The CA Certificate might look like /home/gwuser/awsiot/VeriSign-Class-3-Public-Primary-Certification-Authority-G5.pem.
5. Checkmark Verify server certificate and leave Name empty.
6. Click the Add button and then click the second Add button to return to the main MQTT out node panel.
7. Set the Topic to nuc/pressure, set QoS to 1, and set Retain to false.
8. Set the Name field to Publish to AWS IoT and then click Done.
Drag another function node onto the Node-RED canvas. Double-click to edit the node and set theName to Format JSON. Edit the function code so it looks like this:
msg.payload = {
pressure: Number(msg.payload),
timestamp: Date.now()
};
return msg;
1. Click Done to save the function changes.
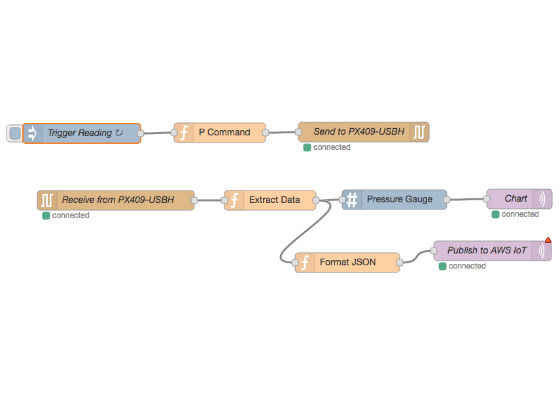
2. Draw a wire from the output of the Extract Data node to the input of Format JSON, and another wire from the output of Format JSON to the input of Publish to AWS IoT. These changes will convert the pressure reading into a JSON object and send it to AWS IoT.
3. Click the Deploy button to deploy and activate the changes. The finished flow should look like Figure 5.
Figure 5. Finished flow with connection to AWS IoT
Back in the AWS IoT console, start the MQTT Client and subscribe to the topic nuc/pressure. You should see messages arriving once a second containing live pressure readings. Vary the pressure on the sensor and observe the values increasing and decreasing.
Recording and Visualizing Pressure History in AWS* IoT
Now that live pressure data is arriving in AWS IoT, a variety of additional data processing can be performed in the AWS cloud. Here we’ll send the data into Elasticsearch where it can be searched and visualized on dashboards.
1. In the AWS console, navigate to the Elasticsearch Service and provision an Elasticsearch cluster with a domain name of nucdata. You can initially make it a small cluster with one instance.
2. Set the security access policy to your Internet access preferences and also add a policy for principal“AWS”: ""* to access “Action”: “ESHttpPut”. Wait for the cluster provisioning to complete and the Domain status to change to Active.
3. Use curl or a REST tool to create an Elasticsearch index named nucs using the Endpoint URI listed in the AWS Elasticsearch cluster console. When creating the index, include a type named nuc with two properties: pressure of type float and timestamp of type date.
4. In the AWS IoT console, create a Rule named Record_Pressure.
5. Set the Description to Record pressure readings to Elasticsearch, set the Attribute topressure,timestamp and set the Topic Filter to nuc/pressure. Leave Condition blank.
6. In the action section choose an action of Send the message to a search index cluster (Amazon Elasticsearch Service) and select nucdata for the Domain name. The Endpoint will be filled in automatically.
7. Set the ID to ${newuuid()}, set the Index to nucs, and set the Type to nuc.
8. For the Role name, click Create a new role and set the role name to aws_iot_elasticsearch.
9. Click Add action and then click Create to create the rule. This rule will take data from the nuc/pressure MQTT topic and send it into Elasticsearch where it can be searched and viewed.
To search and view data:
1. Navigate to your Elasticsearch cluster Kibana URI and create an index pattern named nucs usingtimestamp as the Time-field name. You should see pressure and timestamp in the fields list.
2. Navigate to the Kibana Discover tab and enable auto-refresh at a 5 second interval. You should see roughly 5 new data records every 5 seconds – these are the pressure readings coming from the NUC.
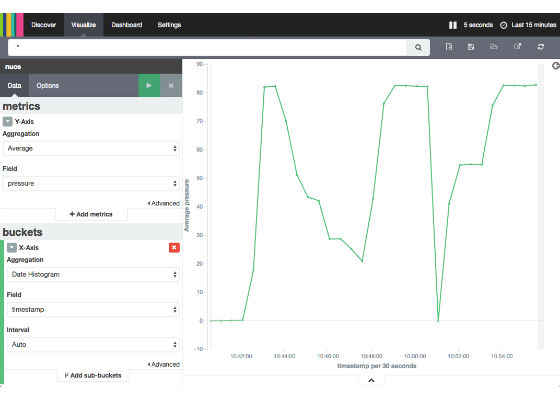
3. Navigate to the Visualize tab and create a Line chart time series visualization using X and Y parameters shown in Figure 6.
4. Now vary the actual pressure on the sensor and watch the time series graph in Kibana. Figure 6 shows a live pressure cycle starting at 0 PSI, jumping to 82 PSI, incrementally stepping down to 20 PSI, ramping up to 76 and then 82 PSI, dropping abruptly to 0 PSI, stepping up to 55 PSI for a short period, and then stepping up to 82 PSI.
Figure 6. Live graph of pressure reading data in AWS
For more such intel IoT resources and tools from Intel, please visit the Intel® Developer Zone
Source: https://software.intel.com/en-us/articles/tutorial-intel-iot-gateway-industrial-oil-gas-pressure-sensor-and-aws-iot

