
Recently my wife purchased a thick and expensive book. As an ultrasonic diagnostician for children, she purchases many books, but this one had me puzzled. The book was titled Ultrasound Anatomy of the Healthy Child. Why would she need a book that showed only healthy children? I asked her and her answer was simple: to diagnose any disease, even one not yet discovered, you need to know what a healthy child looks like.
In this article we will act like doctors, analyzing and comparing a healthy and a not-so-healthy application.
Knock – knock – knock.
The doctor says: “It’s open, please enter.”

In walks our patient, Warrior Wave*, an awesome game in which your hand acts as the road for the warriors to cross. It’s extremely fun to play, innovative, and uses Intel® RealSense™ technology.
While playing the game, though, something felt a little off. Something that I hadn’t felt before in other games based on Intel® RealSense™ technology. The problem could be caused by so many things, but what is it in this case?
Like any good doctor who is equipped with the latest and greatest analysis tools to diagnose the problem, we have the perfect tools to analyze our patient.
Using Intel® Graphics Performance Analyzer (Intel® GPA) Platform Analyzer, we receive a time-line view of our application’s CPU load, frame time, frames per second (FPS), and draw calls:
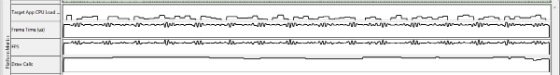
Let’s take a look.
Hmm… the first things that catch our eye are the regular FPS surges that occur periodically. All is relatively smooth for ~200 milliseconds and then jumps up and down severely.
For comparison, let’s look at a healthy FPS trace bellow. The game in this trace felt smooth and played well.

No pattern was evident within the frame time, just normal random deviations.
But in our case we see regular surges. These surges happen around four times a second. Let’s investigate the problem deeper, by zooming in on one of the surges and seeing what happening in the threads:
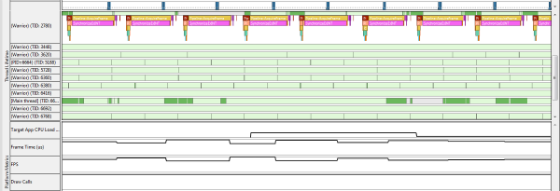
We can see that working thread 2780 spends most of the time in synchronization. The thread does almost nothing but wait for the next frame from the Intel® RealSense™ SDK:

At the same time, we see that rendering goes in another worker thread. If we scroll down, we find thread 2372.

Instead of “actively” waiting for the next frame from the Intel RealSense SDK, the game could be doing valuable work. Drawing and Intel®
RealSense™ SDK work could be done in one worker thread instead of two, simplifying thread communication.
Excessive inter-thread communication can drastically slow down the execution and cause many problems.
Here is the example of a “healthy” game, where the Intel® RealSense™ SDK work and the DirectX* calls are in one thread.

RealSense™ experts say: there is no point in waiting for the frames from the Intel® RealSense™ SDK. They won’t be ready any faster.
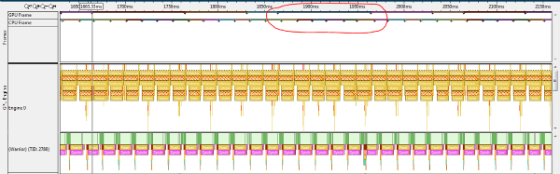
But we can see that the main problem is at the top of the timeline.
On average, five out of six CPU frames did not result in a GPU frame. This is the cause of the slow and uneven GPU frame rate, which on average is less than 16 FPS.
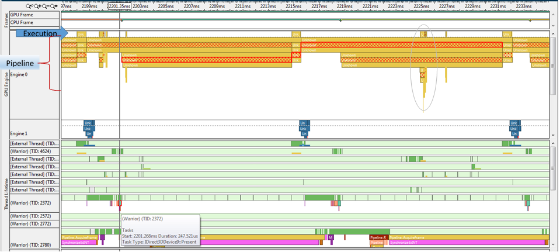
Now let’s look at the pipeline to try and understand how the code is executing. Looking at the amount of packets on “Engine 0,” the pipeline is filled to the brim, but the execution is almost empty.

The brain can process 10 to 12 separate images per second, perceiving them individually. This explains why the first movies were cut at a rate of 16 FPS: this is the average threshold at which the majority of people stop seeing a slide show and start seeing a movie.
Once again, let’s see the profile of the nice-looking game:
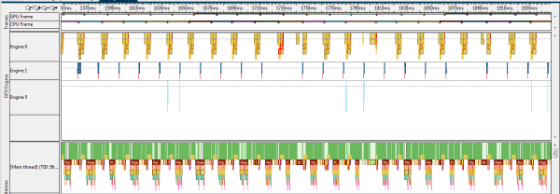
Notice that the GPU frames follow the CPU frames with little shift. For every CPU frame, there is a corresponding GPU that starts execution after a small delay.
Let’s try to understand why our game doesn’t have this pattern.
First, let’s examine our DirectX* calls. The highlighted one with the tooltip is our “Present” call that sends the finished frame to the GPU. In the screenshot above, we see that it creates a “Present” packet on the GPU pipeline (marked with X’s). At round the 2215 ms mark, it has moved closer to execution, jumping over three positions, but at 2231 ms it just disappears without completing execution.
And if we look at each present call within the trace, not one call successfully makes it to execution.
Question: How does the game draw itself if all our DirectX* Present calls are ignored?! Good thing we have good tools so we can figure this out. Let’s take a look.
Can you see something curious inside the gray oval? We can see that this packet, not caused by any DirectX* call of our code, still gets to the execution, fast and out of order. Hey, wait a minute!!!
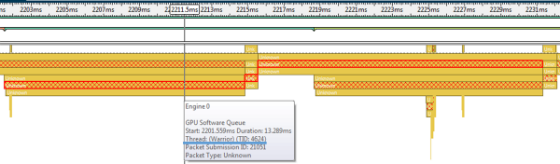
Let's look closely at our packet.
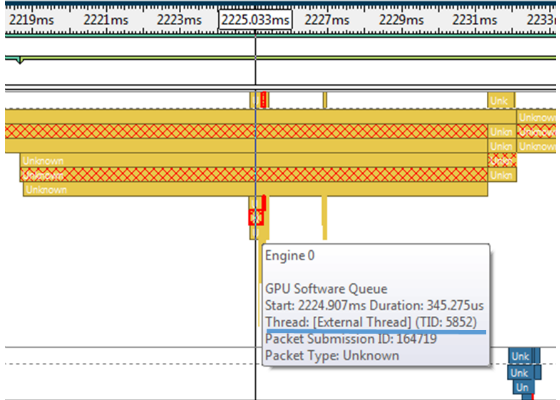
And now to the packet that got executed.
Wow! It came from an EXTERNAL thread. What could this mean? External threads are threads that don’t belong to the game.
Our own packets get ignored, but an external thread draws our game? What? Hey, this tool went nuts!
No, the image is quite right. The explanation is that on the Windows* system (starting with Windows Vista*), there is a program called Desktop Window Manager (DWM), which does the actual composition on the screen. Its packets are the ones we see executing at a fast rate with high priority. And no, our packets aren’t lost—they are intercepted by DWM to create the final picture.
But why would DWM get involved in a full- screen game? After thinking a while, I realized that the answer is simple: I have a multi-monitor desktop configuration. Switching my second monitor off the schema made the Warrior Wave behave like other games: normal GPU FPS, no glitches, and no DWM packets.
The patient will live! What a relief!
But other games still worked well even with a multi-monitor configuration, right (says the evil voice in the back of my head)?
To dig deeper, we need another tool to do that. Intel® GPA Platform Analyzer allows you to see CPU and GPU execution over time, but it doesn’t give you lower level details of each frame.
We would need to look more closely at the Direct3D* Device creation code. For this we could use Intel® GPA Frame Analyzer for DirectX*, but this is a topic for another article.
So let’s summarize what we have learned:
During this investigation we were able to detect poor usage of threads that led to FPS surges and a nasty DWM problem that was easily fixed by switching the second monitor of the desktop schema.
Conclusion: Intel® GPA Platform Analyzer is a must-have tool for initial investigation of the problem. Get familiar with it and add it to your toolbox.
For more such intel resources and tools from Intel on Game, please visit the Intel® Game Developer Zone
Source: https://software.intel.com/en-us/articles/platform-analyzer-analyzing-healthy-and-not-so-healthy-applications


