 System Studio Developer Story : With Intel ® JTAG debugger and MinnowBoard MAX, how to debug exception errors in the Android-Linux-Kernel.")
Intel(R) System Studio Developer Story : With XDB and MinnowBoard MAX , how to debug exception errors in the Android-Linux-Kernel.
In this article, we can see how to debug and check the exception error in Android Linux Kernel in Intel ® Architecture-based system with Intel ® JTAG Debugger which is a part of tool Intel System Studio ® Ultimate Edition. In doing so, we are supposed to see what is the JTAG and Intel ® JTAG Debuggerand some information of the exception handling of Intel ® Architecture-based system as well. We are going to use the MinnowBoard MAX as Intel ® Architecture-based target system.
1. JTAG overview
JTAG stands for Joint Test Action Group and is pronounced to jay-tag but, which is normally meaning IEEE std 1149.1-1990 IEEE Standard Test Access Port and Boundary-Scan Architecture. This standard is to do debug and test SoC (System On Chip) and Microprocessor Software.
The configuration of a JTAG debugging is consist of three parts ; JTAG Debugger Software in a host machine, JTAG probe and On chip debug(OCD) in SoC.
1.1 JTAG Debugger Software
JTAG Debugger is a software tool in a host machine. It is getting addresses and data from JTAG probe and showing it to user and user can send data and address to JTAG probe via USB or other PC connectives as vice versa. By using this tool, user can do run-control and source line debug with loaded symbol of the image – the binary image is downloaded to target system – such as run, stop, step into, step over, set break point and an accessing memory is possible as well. So user can easily do debugging the SW of target system and inspect a system memory and registers. Intel System Studio ® Ultimate Edition has Intel ® JTAG debugger (a.k.a. XDB) for host side JTAG debugger software.
1.2 JTAG Probe (or JTAG Adapter)
JTAG Probe is the HW box which converts JTAG signals to PC connectivity signals such as USB, parallel, RS-232, Ethernet. USB is most popular one and many of JTAG Probe is using the USB as a connection to host PC. Even though there is minimal standard JTAG pin numbers, a target side interface has many variations – e.g. ARM 10-pin, ST 14-pin, OCDS 16-pin, ARM 20-pin. Intel ® JTAG debugger and MinnowBoard MAX configurations which is used in this article has 60-pin connection with a target.Intel ®ITP-XDP3 probe is used as the JTAG probe for MinnowBoard MAX. Intel ® JTAG debugger is also compatible with JTAG probe from other vendors such as Macraigor® Systems usb2Demon® , OpenOCD.
1.3 On Chip Debug (Target SoC)
The main component of OCD is TAP (Test Access Point) and TDI(Test Data In) / TDO(Test Data Out). By using TAP we can reset or read/write register and bypass and the main technology of JTAG is Boundary Scan by TDI/TDO signal line (Click for more details and picture).
< Figure 1-1> Configuration of JTAG probe and target system – Lure is the small pin adapter for Intel ® ITP-XDP3 and MinnowBoard MAX.

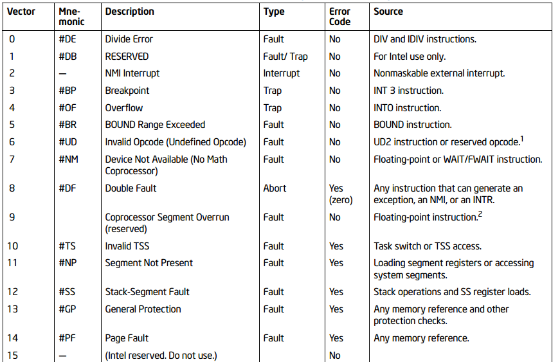
2. Overview of Exception in Intel Architecture
An exception is a synchronous event that is generated when the processor detects one or more predefined
conditions while executing an instruction. The IA-32 architecture specifies three classes of exceptions: faults,
traps, and aborts. Normally faults and traps are recoverable while abort does not allow a restart of the program. When there is exception, it is processed as same way as interrupt handling. Which means that after halting and save current process then system switches to the exception handler and comes back again once an exception handling is done.
< Table 2-1 > Protected-Mode Exceptions and Interrupts
3. Prepare the MinnowBoard MAX and Intel® ITP-XDP3 with a host PC connection via USB
You need to set up MinnowBoard MAX with Android OS. For this, please see the "Intel(R) System Studio Developer Story : How to configure, build and profile the Linux Kernel of Android by using the VTune" article (Please click). It has the introduction of MinnowBoard MAX and how to set up / build / download Android OS in MinnowBoard MAX.
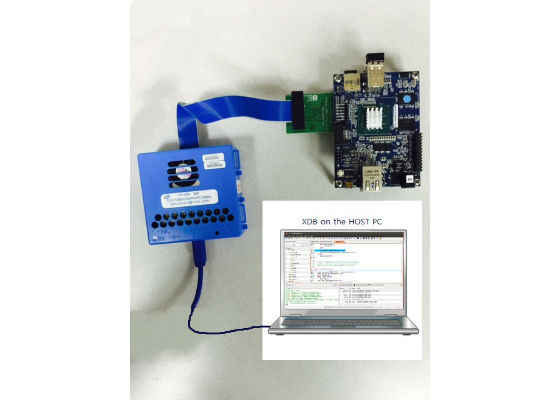
Connect MinnowBoard MAX with the lure (which is small PCB with 60 pin JTAG connector) to Intel ® ITP-XDP3 JTAG probe and Intel ® ITP-XDP3 to a host PC via USB. And host PC should have been installed Intel ® System Studio Ultimate Edition for the USB driver of Intel ® ITP-XDP3.
<Figure 3-1> Connections of MinnowBoard MAX, Intel ® ITP-XDP3 JTAG probe and Intel ® JTAG debugger (XDB) on the host PC.
4. Using a Intel ® JTAG debugger (XDB) for exceptions of Android Kernel on MinnowBoard MAX.
We see the step by step procedure of using Intel ® JTAG debugger to check and debug the exception in a Kernel.
(1) Run Intel ® JTAG debugger : Go to the Installed directory and run the batch file. (e.g. start_xdb_legacy_products.bat).
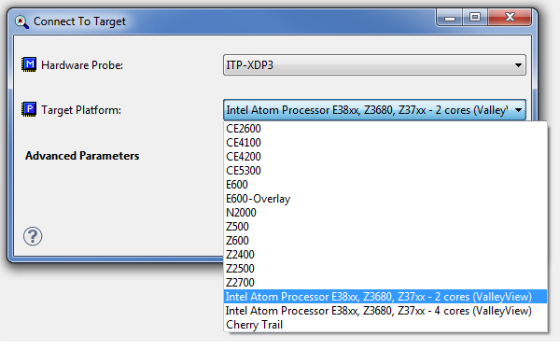
(2) Connect to the target : Go to the Intel ® JTAG debugger menu – File – Connect and select Intel ® ITP-XDP3 and Z3680, Z37xx.
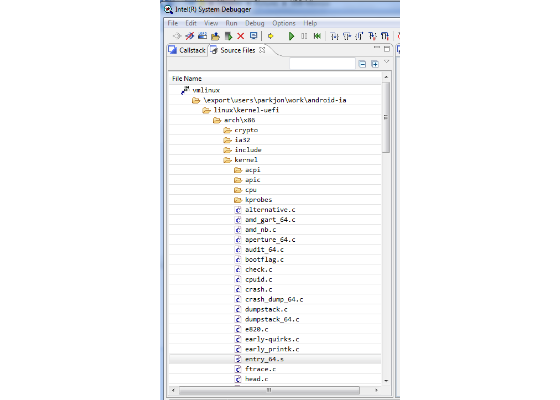
(3) Load the symbol files and set the directory of source files. Go to the Intel ® JTAG debugger menu – File – Load / Unload Symbol and set the symbol files. Per source files, go to the Intel ® JTAG debugger menu – Options – Source Directories and set the rule and directories. Rule is to adjust files directory between current source path and path in the symbol file which recorded in compile time.
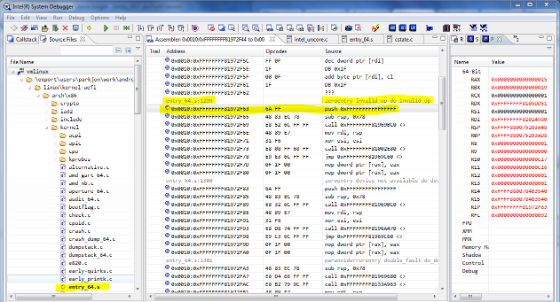
(4) Browse to the entry file which has exception handler : Intel ® JTAG debugger menu – View – Source files and open the entry_64.S file.
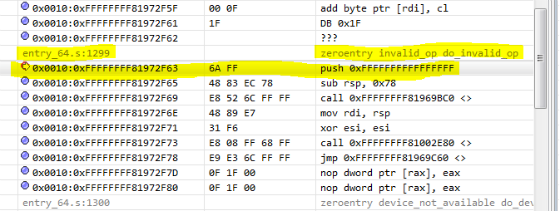
(5) Set break point in the exception entry point : Go and find the ENTRY(error_entry) which is entry point of exception with an error code in rax register. And each exception handler is defined as zeroentry or errorentry macros, so you can set break point in the error_entry or some specific handler. In this article, we are using the "zeroentry invalid_op do_invalid_op" for testing.
01 ENTRY(error_entry)
02 XCPT_FRAME
03 CFI_ADJUST_CFA_OFFSET 15*8
04 /* oldrax contains error code */
05 cld
06 movq_cfi rdi, RDI+8
07 movq_cfi rsi, RSI+8
08 movq_cfi rdx, RDX+8
09 movq_cfi rcx, RCX+8
10 movq_cfi rax, RAX+8
11 movq_cfi r8, R8+8
12 movq_cfi r9, R9+8
13 movq_cfi r10, R10+8
14 movq_cfi r11, R11+8
15 movq_cfi rbx, RBX+8
16 movq_cfi rbp, RBP+8
17 movq_cfi r12, R12+8
18 movq_cfi r13, R13+8
19 movq_cfi r14, R14+8
20 movq_cfi r15, R15+8
21 xorl %ebx,%ebx
22 testl $3,CS+8(%rsp)
23 je error_kernelspace
22 error_swapgs:
25 SWAPGS
26 error_sti:
27 TRACE_IRQS_OFF
28 ret
29 <….>
30 zeroentry divide_error do_divide_error
31 zeroentry overflow do_overflow
32 zeroentry bounds do_bounds
33 zeroentry invalid_op do_invalid_op
34 zeroentry device_not_available do_device_not_available
35 paranoiderrorentry double_fault do_double_fault
36 zeroentry coprocessor_segment_overrun do_coprocessor_segment_overrun
37 errorentry invalid_TSS do_invalid_TSS
38 errorentry segment_not_present do_segment_not_present
39 zeroentry spurious_interrupt_bug do_spurious_interrupt_bug
40 zeroentry coprocessor_error do_coprocessor_error
41 errorentry alignment_check do_alignment_check
42 zeroentry simd_coprocessor_error do_simd_coprocessor_error
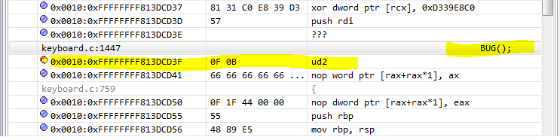
(6) Examples : make an exception and check if the handler got it when we set break point : Set break point to the "zeroentry invalid_op do_invalid_op" and call the BUG() which makes the "Invalid Opcode" fault by ud2 instruction.
1 #define BUG() \
2 do { \
3 asm volatile("ud2"); \
4 unreachable(); \
5 } while (0)
< Call the BUG() >
You add the BUG() macro in your test code of Kenel to make an exception. (In this examples, I added it in keyboard.c to make an exception by special key input sequences.
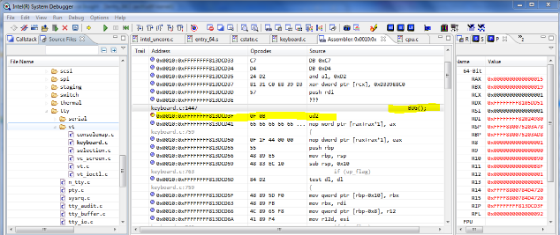
< Stop at the Invalid_op of break point >
You set the break point the exception handler of Invalid opcode or the entry of exception handler. Then you can see and debug where this exception comes from.
5. Conclusion
Some exceptions are critical error of system hardware and software, so it is important what / why / where these kind of exceptions occur. By using Intel ® JTAG debugger, you can easily check it and can do more investigation of these issues. Because Intel ® JTAG debugger provide powerful features like easily accessing the assembly code and source code and checking the call stack and registers.
For more such Android resources and tools from Intel, please visit the Intel® Developer Zone
Source: https://software.intel.com/en-us/articles/intelr-system-studio-developer-story-with-xdb-minnow-board-how-to-debug-exception-errors-in


