Improve Performance of K-Means with Intel Data Analytics Acceleration Library

How do banks identify risky loan applications or credit card companies detect fraudulent credit-card transactions? How do universities monitor students’ academic performance? How do you make it easier to analyze digital images? These are just a few situations that many companies face when dealing with huge amounts of data.
To deal with risky loan or credit card problems, we can divide data into clusters of similar characteristics and look for abnormal behaviors when comparing this to other data in the same cluster. For monitoring students’ performance, school faculties can base on the students’ score range to sort them into different groups. Using a similar concept, we can partition a digital image into many segments based on a set of pixels that closely resemble each other. The idea is to simplify the representation of a digital image making it easier to identify objects and boundaries in an image.
Dividing data into clusters or sorting students’ scores into different groups can be done manually if the amount of data is not large.
However, it would be impossible to do it manually if data is in the range of terabytes and petabytes. Therefore machine-learning1 approach is a good way to solve these types of problems when dealing with large amount of data.
This article discusses an unsupervised2 machine-learning algorithm called K-means3 that can be used to solve the above problems. It also describes how Intel® Data Analytics Acceleration Library (Intel® DAAL)4help optimize this algorithm to improve the performance when running it on systems equipped with Intel® Xeon® processors.
What is Unsupervised Machine Learning?
In the case of supervised learning,5 the algorithm is exposed to a set of data in which the outcome is known so that the algorithm is trained to look for similar patterns in new data sets. In contrast, an unsupervised learning algorithm explores the data set with an unknown outcome. Further, input samples are not labeled and the system has to label them by itself. The system will scan the data and group the ones with similar characteristics/behaviors into what we call clusters. Basically, the system partitions the data set into clusters of similar characteristics and behaviors.
What is K-means?
K-means is an unsupervised machine-learning algorithm.
In order to create clusters, K-means first assigns an initial value of centroids, normally by randomly selecting it. These are the centers for the clusters. Ideally these centers should be as far apart from each other as possible. Next, take the objects in the data set and associate them to the nearest centers to form the initial clusters. Then calculate the new centroids based on the newly formed clusters.
Again, re-associate the objects base on these new centroids. Keep repeating the steps of recalculating new centroids and re-associating the objects until the centroid locations are no longer changed or the algorithm goes through all the specified iterations.
The goal of the K-means algorithm is also to minimize the cost function J below. Sometimes, J is also called the objective or square-error function:
Where:
J = Square-error function
xi = Object i
cj = Centroid for cluster j
k = Number of clusters
nj= Number of objects in jth cluster
|| xi – cj || = Euclidean distance8 between xi and cj
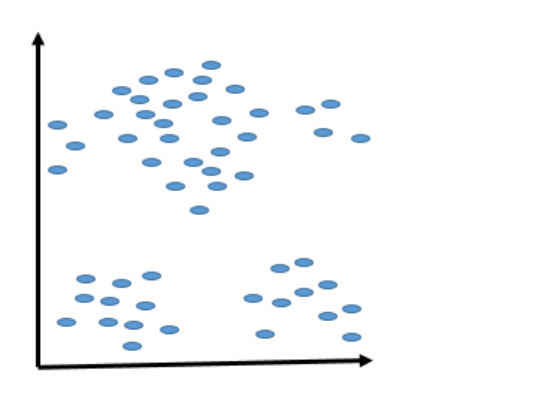
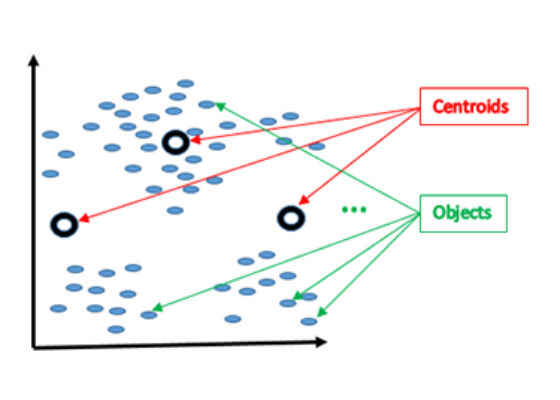
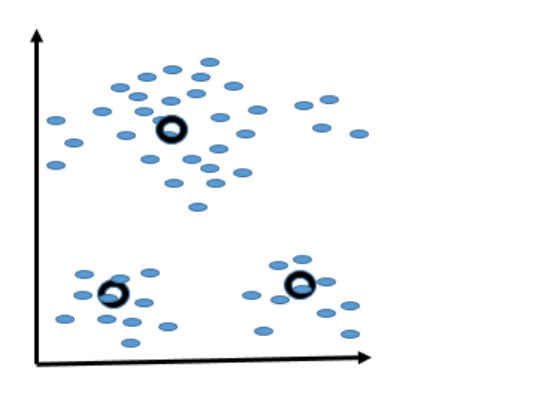
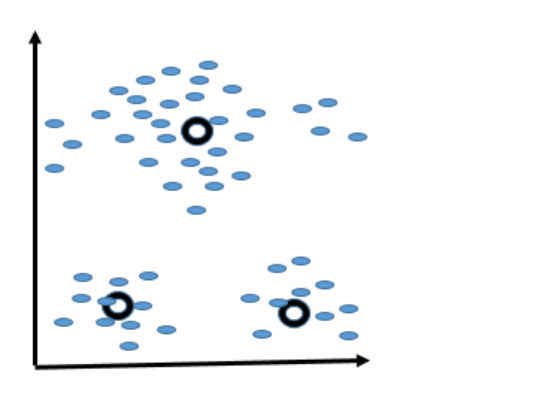
Figures 1–5 show how the K-means algorithm works:
Figure 1. Data set layout showing the objects of the data set are all over the space.
Figure 2. Shows the initial positions of the centroids. In general, these initial positions are chosen randomly, preferably as far apart from each other as possible..
Figure 3. Shows new positions of the centroids after one iteration. Note that the two lower centroids are re-adjusted to be closer to the two lower chunks of objects
Figure 4. Shows the new positions of the centroids after many iterations. Note that the positions of the centroids don’t vary too much compared to those in Figure 3. Since the positions of the centroids are stabilized, the algorithm will stop running and consider those positions final.
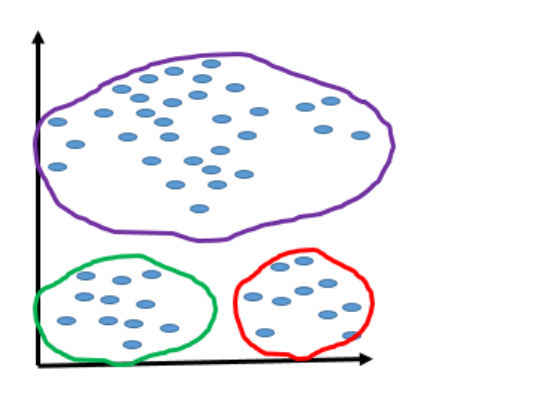
Figure 5. Shows that the data set has been grouped into three separate clusters.
Applications of K-means
- K-means can be used for the following:
- Clustering analysis
- Image segmentation in medical imaging
- Object recognition in computer vision
Advantages and Disadvantages of K-means
The following lists some of the advantages and disadvantages of K-means.
- Advantages
- It’s a simple algorithm.
- In general it’s a fast algorithm except for the worst-case scenario.
- Work best when data sets are distinct and well separate from each other.
Disadvantages
- Requires an initial value of k.
- Cannot handle noisy data and outliers.
- Doesn’t work with non-linear data sets.
Intel® Data Analytics Acceleration Library (Intel® DAAL)
Intel DAAL is a library consisting of many basic building blocks that are optimized for data analytics and machine learning. These basic building blocks are highly optimized for the latest features of the latest Intel® processors. More about Intel DAAL can be found at 4. The K-means algorithm is supported in Intel DAAL. In this article, we use PyDAAL, the Python* API of Intel DAAL, to invoke K-means algorithm,. To install PyDAAL, follow the instructions in 6.
Using the K-means Algorithm in Intel Data Analytics Acceleration Library
This section shows how step-by-step how to use the K-means algorithm in Python7 with Intel DAAL.
Do the following steps to invoke the K-means algorithm from Intel DAAL:
1. Import the necessary packages using the commands from and import
1. Import the necessary functions for loading the data by issuing the following command:
from daal.data_management import FileDataSource, DataSourceIface
2. Import the K-means algorithm and the initialized function ‘init’ using the following commands:
import daal.algorithms.kmeans as kmeans
from daal.algorithms.kmeans import init
2. Initialize to get the data. Assume getting the data from a .csv file
dataSet = FileDataSource(
dataFileName,
DataSourceIface.doAllocateNumericTable,
DataSourceIface.doDictionaryFromContext
)
Where dataFileName is the name of the input .csv data file
3. Load the data into the data set object declared above.
dataSet.loadDataBlock()
4. Create an algorithm object for the initialized centroids.
init_alg = init.Batch_Float64RandomDense(nclusters)
Where Nclusters is the number of clusters.
5. Set input.
init_alg.input.set(init.data, dataSet.getNumericTable())
6. Compute the initial centroids.
initCentroids_ = init_alg.compute().get(init.centroids)
Where initCentroids is the initial value of centroids.
Note: The above initCentroids value is randomly calculated using the above function, Batch_Float64RandomDense. Users can also assign a value to it.
7. Create an algorithm object for clustering.
cluster_alg = kmeans.Batch_Float64LloydDense(nclusters, nIterations)
8. Set input.
cluster_alg.input.set(kmeans.data, dataSet.getNumericTable())
cluster_alg.input.set(kmeans.inputCentroids, initCentroids)
9. Compute results.
result = cluster_alg.compute()
The results can be retrieved using the following commands:
self.centroids_ = result.get(kmeans.centroids)
self.assignments_ = result.get(kmeans.assignments)
self.goalfunction_ = result.get(kmeans.goalFunction)
self.niterations_ = result.get(kmeans.nIterations)
Conclusion
K-means is one of the simplest unsupervised machine-learning algorithms that is used to solve the clustering problem. Intel DAAL contains an optimized version of the K-means algorithm. With Intel DAAL, you don’t have to worry about whether your applications will run well on systems equipped with future generations of Intel Xeon processors. Intel DAAL will automatically take advantage of new features in new Intel Xeon processors. What you need to do is link your applications to the latest version of Intel DAAL.
For more such intel IoT resources and tools from Intel, please visit the Intel® Developer Zone
Source:https://software.intel.com/en-us/articles/improve-performance-of-k-means-with-intel-data-analytics-acceleration-library


