Get a Helping Hand from the Vectorization Advisor
Get a Helping Hand from the Vectorization Advisor
If you have not tried the new Vectorization Advisor yet, you might find this story of how it helped one customer sufficiently motivating to give it a look! It is like having a trusted friend look over your code and give you advice based on what he sees. As you’ll see in this article, user feedback on the tool has included, “there are significant speedups produced by following advisor output, I'm already sold on this tool!”
What’s common among airplane surfaces, inkjet printing, and separation of oil/water mixtures or protein solutions used in brand new shampoos? Computational chemists will tell you that advancing in all these areas normally requires performing mesoscopic simulations of condensed matter. “Mesoscopic” means that such simulations have to deal with quantities of matter slightly bigger than the size of atoms, while “condensed matter” implies that quite likely you will be modeling liquids or solid states.
To address a wide range of mesoscale-related science and industry demands, research scientists at STFC Daresbury Laboratory in the United Kingdom have developed a mesoscopic simulation package called “DL_MESO.” DL_MESO has been adopted in European industry by companies such as Unilever,Syngenta and Infineum, who use mesoscale simulation when figuring out optimal formula [computer-aided formulation (CAF)] for shampoos, detergent powders, agrochemicals or petroleum additives.
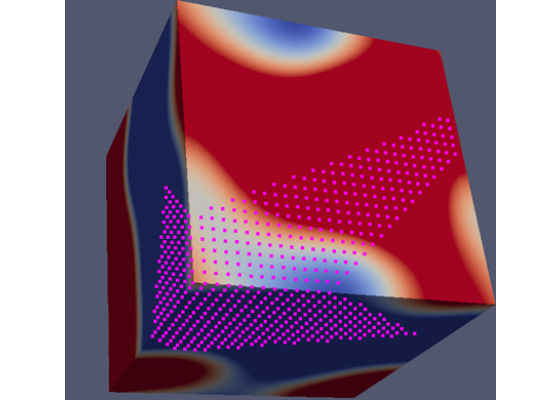
Figure 1. Visualization of the 3D_PhaseSeparation benchmark.
The computer-aided formulation simulation process is often time and resource consuming, so from the very beginning Daresbury experts were interested in performance-aware design and optimization of DL_MESO for modern platforms; that helps explain why DL_MESO was chosen as one of the Intel® Parallel Computing Center(s) (Intel® PCC) collaboration projects between Hartree and Intel Corporation1.
Intel PCC projects focus on using the latest techniques for code modernization on the latest systems. As such, it is a natural fit for Intel PCC projects to look to adopt new technology that may assist in code modernization.
The DL_MESO engineers made good use of early pre-release versions of the Vectorization Advisor analysis tool in early 2015 (the product version of Vectorization Advisor is now part of Intel® Advisor 2016within Intel® Parallel Studio XE 2016.)
The interest in new technology was driven by DL_MESO developers’ intention to fully exploit vector parallelism capabilities on modern Intel platforms. For multi-core Intel® Xeon® processors or many-core Intel® Xeon Phi™ platforms, code can only reach good performance if it exploits both levels of CPU parallelism: multi-core parallelism and vector data parallelism. With 512-bit-wide SIMD instructions, efficiently vectorized code becomes theoretically capable of delivering 8x more performance for double-precision (or 16x for single-precision) floating point computations over the performance of non-vectorized code. DL_MESO developers did not want to leave so much performance on the table.
In this article, we show how the Vectorization Advisor was used by Michael Seaton and Luke Mason, computational scientists in the Daresbury lab, to analyze the DL_MESO Lattice Boltzmann Equation code2. One of the lead developers at Hartree was so impressed by the results of using the Vectorization Advisor that he enthusiastically wrote, “there are significant speedups produced by following advisor output, I'm already sold on this tool!”
On new multi-core Intel Xeon processors and many-core Intel Xeon Phi coprocessors, you can achieve optimal performance by ensuring that your applications exploit two levels of CPU parallelism: multi-core parallelism and vector data parallelism.
There is a wide range of techniques available to vectorize your application, including:
Using libraries that are already vectorized, such as the Intel® Math Kernel Library (Intel® MKL). The advantage of this approach is you bypass much of the programming effort needed to vectorize code by using the optimized library functions.
Letting the compiler automatically vectorize your code. This has been the traditional route that many developers have relied on when using the Intel compiler – and the Intel compiler does an amazing job!
Explicitly adding pragmas or directives, such as the OpenMP* SIMD pragmas/directives. Increasingly, this is becoming the option of choice amongst developers, giving a greater level of vectorization control compared to just relying on auto-vectorization – without being locked into too low a programming level.
nserting vector-aware code using vector intrinsic functions, C++ vector classes or assembler instructions. This technique requires that you have a good working knowledge of the functions and instructions that support vectorization. Any code you write in this way will be much less portable than the other techniques mentioned above.
Whichever way you choose to produce vectorized code, it’s important that the resultant code efficiently exercises the vector units of the processor. In the DL_MESO library, the Daresbury programmers are using the OpenMP 4.x programming standard to improve the vectorized performance.
Vectorization Advisor
The Vectorization Advisor is one of the two major features of Intel® Advisor 2016. Intel Advisor includes the Vectorization Advisor and a Threading Advisor.
The Vectorization Advisor is an analysis tool that lets you:
- For unvectorized loops, discover what prevents code from being vectorized and get tips on how to vectorize it.
- For vectorized loops that use modern SIMD instructions, measure their performance efficiency and get tips on how to increase it.
- For both vectorized and unvectorized loops, explore how the memory layout and data structures can be made more vector friendly.
You can use the Vectorization Advisor with any compiler, but the tool really excels when coupled with the Intel compilers. Not only does Intel Advisor give a more user-friendly view of various Intel compiler-generated reports, it elegantly brings together the results of the compile-time analysis, static analysis of the contributing binaries, and runtime workload metrics such as CPU hotspots and exact loop trip counts.
Along with the merging of this static and dynamic analysis comes a set of recommendations that you can use in your optimization efforts.
With the Vectorization Advisor, the gap is filled between static compiler-time and dynamic runtime knowledge, giving the benefits of interactive feedback and a rich set of dynamic binary profiles3.
Intel Advisor Survey: one-stop-shop DL_MESO performance overview
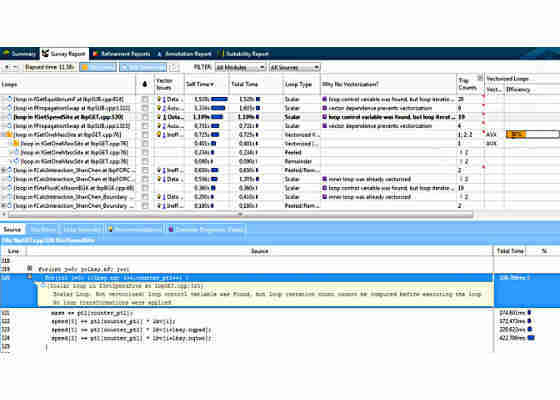
The Intel Advisor user interface is cleverly designed to bring together all the salient vectorization features of your code into one place, almost like a one-stop shop – as can be seen in Figure 2, which shows the initial analysis of the Lattice Boltzman component using the vectorization survey analysis and trip counts features of Intel Advisor.
Looking at the Intel Advisor Survey Report, you can see that about half of the total execution time is consumed by the top ten hotspots, with no outstanding leaders among them; all time-consuming loops take no more than 12% of cumulative program time. This type of profile could be characterized as relatively flat. A flat profile is usually bad news for a software developer, because in order to achieve noticeable cumulative workload speedup, there is a need to go through many hotspots and individually profile and optimize each of them, which is time consuming unless there is some software tool assistance provided.
Figure 2. Survey Report with Trip Counts.
The Vectorization Advisor enabled the quick categorization of their hotspots as follows:
1. Vectorizable, but not vectorized loops that required some minimal program changes (mostly with the help of OpenMP 4.x) to enable compiler-driven SIMD parallelism. The top four hotspots in theSurvey Report belong to this category.
2. Vectorized loops whose performance could be improved using low-hanging optimization techniques.
3. Vectorized loops whose performance was limited by data layout (and thus requiring code refactoring to further speed up execution). As we will see later, after applying techniques corresponding to the two categories above, hotspots #1 and #2 transition to this category.
4. Vectorized loops that performed well.
5. All other cases (including non-vectorizable kernels).
Not only does Vectorization Advisor give information about the loops, the Recommendations andCompiler Diagnostic Details tabs can be used to learn more about specific issues and to find out how to fix them.
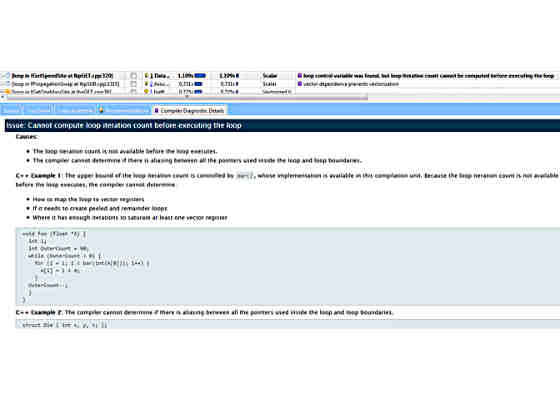
In our case, the third hotspot fGetSpeedSite could not be vectorized because the compiler could not work out how many loop iterations there would be. Figure 3 shows the Intel Advisor Compiler Diagnostic Details window for this problem, along with an example and suggestions how to fix the problem. By following the given suggestion, the given loop has been easily vectorized and transitioned from category #2 to category #4.
Figure 3. Interactive Compiler Diagnostics Details window in the Intel Advisor Survey Report.
Even when code can be vectorized, simply enabling vectorization doesn’t always lead to a performance improvement – that is, loops that fall into category #2 and #3. That’s why it is important to examine loops that have already been vectorized to confirm that they are performing well. In the next section we will briefly discuss optimization results achieved by the Daresbury lab when applying Intel Advisor to inefficiently vectorized loops.
Low-hanging fruit optimization: loop padding
The code for the hottest loop from the DL MESO profile is shown in Figure 4.
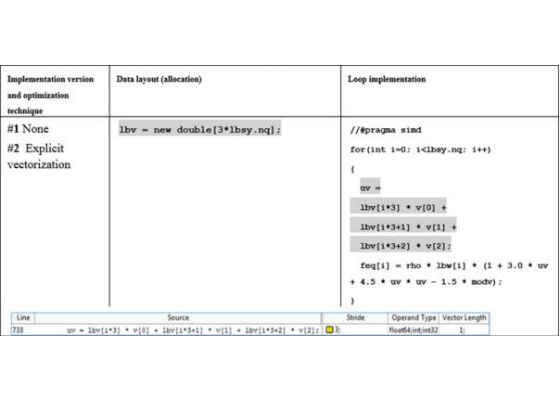
The array lbv stores the velocities for the lattice in each dimension, the loop count variable lbsy.nq being the number of velocities. In our case, the model represents the three-dimensional 19-velocity lattice (D3Q19 schema), so the value of lbsy.nq is 19. The resulting equilibrium is stored in the array feq[i].
In the initial analysis, the loop was reported as being a scalar loop – that is, the code was not vectorized. By simply adding #pragma omp simd just in front of the for loop, the loop was vectorized, with its impact on the total run time dropping from 13% to 9%. Even with this addition, there is still more scope for optimization.
int fGetEquilibriumF(double *feq, double *v, double rho)
{
double modv = v[0]*v[0] + v[1]*v[1] + v[2]*v[2];
double uv;
for(int i=0; i<lbsy.nq; i++)
{
uv = lbv[i*3] * v[0]
+ lbv[i*3+1] * v[1]
+ lbv[i*3+2] * v[2];
feq[i] = rho * lbw[i]
* (1 + 3.0 * uv + 4.5 * uv * uv – 1.5 * modv);
}
return 0;
}
Figure 4. Code listing – loop for calculating equilibrium distribution.
The new results displayed by Intel Advisor showed that the compiler generated not one, but two loops:
- A vectorized loop body with a vector length (VL) of 4 – that is, four doubles held in the 256-bit-wide AVX registers
- A scalar remainder that consumes almost 30% of loop time
Such a scalar remainder is an unnecessary overhead. The existence of this remainder loop has a detrimental effect on the parallel efficiency – that is, the maximum speedup that could be achieved. Such a big remainder overhead is actually caused by the loop (trip) count not being a multiple of the vector length. When the compiler vectorizes the loop, it generates the vectorized body, which in our case executes loop iterations number 0-15. The remaining three iterations, 16-18, are executed by the scalar remainder code. Since the total loop count is quite small, then the three iterations remaining become a significant part of elapsed loop time. In an ideally optimized loop, and especially those with a low trip count, there should be no remainder code.
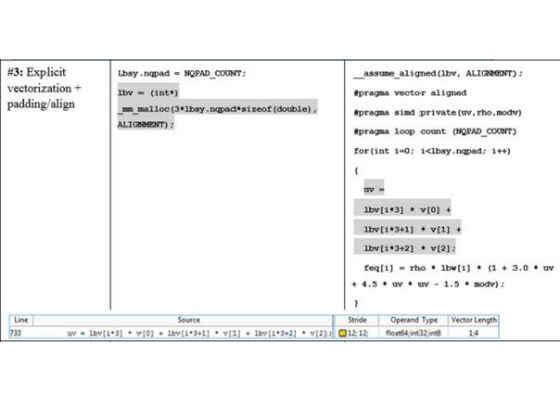
One technique we can apply to this code is to increase the loop iterations count to become a multiple of VL, which is 20 in our case. This technique is called “data padding” and this is exactly what Intel Advisor explicitly suggests in the Recommendations window for this loop (as seen in Figure 5). In order to pad the data, we need to increase the size of the arrays feq[], lbv[]and lbw[] so that accessing the (unused) 20th location will not cause a segmentation violation or similar problem.
The second row of Figure 11 gives an example of the change that is needed. The value lbsy.nqpad is a summation of the original loop trip count and the padding value (NQPAD_COUNT).
You will also see that DL_MESO code developers have added the #pragma loop count directive. By telling the compiler what the loop count will be, the compiler sees that the count is a multiple of the vector length and optimizes code generation for the particular trip count value so that scalar remainder invocation code is omitted in runtime.
Figure 5. The Vectorization Advisor recommendations for padding the data.
In the DL_MESO code, there are a number of similar equilibrium distribution code constructs that can be modified in the same way. In our example, we modified three other loops in the same source file and achieved a speedup of 15% on each loop.
Balancing overheads and optimization trade-offs
The padding technique that we used for the first two loops has both performance and code maintenance costs.
- From a performance perspective, by padding we avoid overhead in the scalar part, but we introduce extra computations in the vector part.
- From a code maintenance perspective, we have to rework data structure allocations and potentially introduce workload-dependent pragma definitions.
Fortunately, in our case, the performance benefit outweighs any performance loss, and the code maintenance burden is light.
Further progress with data layout Structure of Arrays transformation
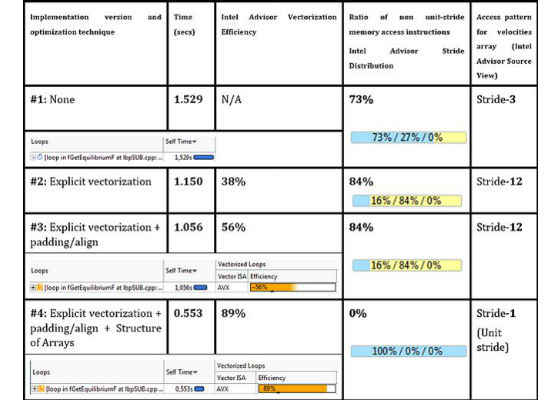
Vectorization, loop padding and data alignment techniques have boosted the number 1 hotspot performance by 25-30%, while parallel vectorization efficiency reported by Intel Advisor4 has grown up to 56%.
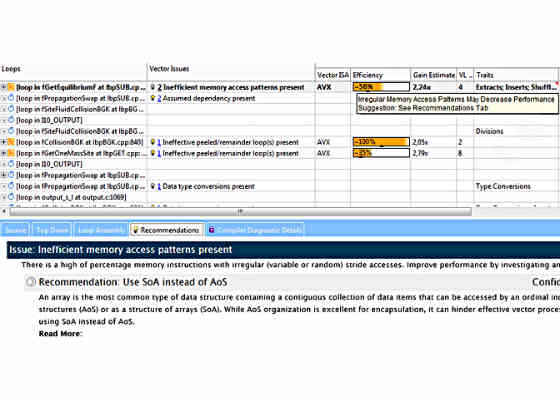
Since 56% is pretty far from the ideal 100%, Daresbury developers wanted to further investigate performance blockers preventing loops from achieving higher efficiencies. One more time they looked atVector Issues/Recommendations. This time, the Vector Issues column highlighted a new problem:Possible inefficient memory access patterns present. The associated recommendation was to run a Memory Access Patterns (MAP) analysis. A similar suggestion was also emitted in the Instruction Set Architecture/ Traits column (Figure 6).
Figure 6. “Inefficient Memory Access patterns present”: Vector Issue, Trait and associated Recommendations.
MAP is a deeper-dive Intel Advisor analysis type, making it possible to identify and characterize inefficient memory access patterns in detail. In order to run the MAP tool, DL_MESO optimizers have used the following GUI–based scheme:
- First, developers marked the loop of interest at line 730 by selecting the appropriate checkbox in the second column in the Survey Report (Figure 7).
- After that, they ran Memory Access Patterns collection using the Workflow panel.
Figure 7. Selecting loops for deeper MAP or Dependencies analysis.
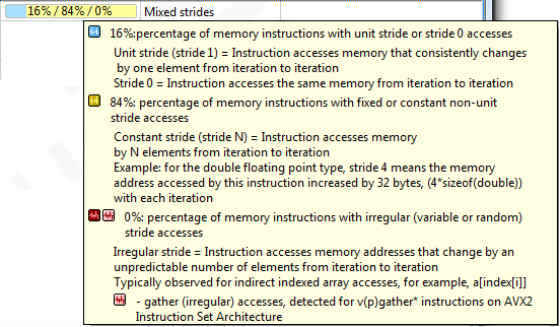
The high-level Strides Distribution measured as a result of MAP analysis indicated that both unit-stride and non-unit constant stride accesses took place in the loop (see Figure 9). A further dive into the MAPProblems view and Source view helped to identify the presence of stride-3 (in the case of the original scalar version) or stride-12 (in the case of the padded, vectorized loop) accesses corresponding to manipulation with the lbv array.
The presence of constant stride means that from iteration to iteration, access to some array elements shifts in a predictable but non-linear manner. In our case, stride-3 access to the lbv velocities array of integer elements meant that every next iteration, the access to the lbv array is shifted by 3 integer elements. The value of 3 was not surprising since the corresponding expression looks like lbv[i*3+X].
Figure 8. Inefficient memory access… Vector Issue and corresponding Recommendations.
Non-contiguous constant stride is not really good for vectorization, because it usually means that in the vectorized code version it will be impossible to load all array elements into the resulting vector register altogether using a single packed memory move instruction.5 On the other hand, constant stride access is often quite possible to transform to unit (contiguous) stride access by applying an Array of Structures (AoS) to Structure of Arrays (SoA) transformation technique.6 Noticeably, after running MAP analysis, the original recommendation for the loop in fGetEquilibirumF has automatically updated with a suggestion to apply the given AoS->SoA transformation (figure 8).
Figure 9. Strides Distribution loop analysis and corresponding tooltip with stride taxonomy explanation.
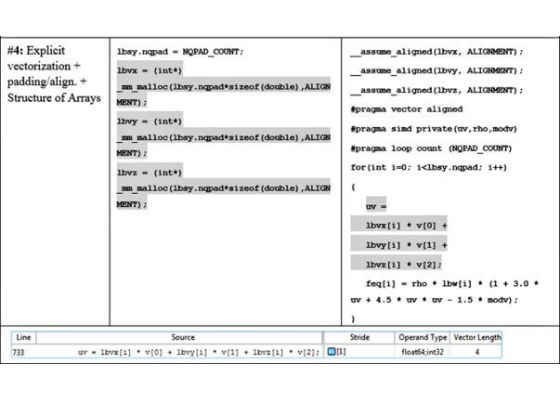
Daresbury engineers decided to apply the given data layout optimization with regards to the lbv array. It was actually the latest optimization technique applied to the loop in fGetEquilibrium. In order to do this transformation, they needed to replace the single lbv array (incorporating velocities in X, Y and Z dimensions altogether) with three separate lbvx, lbvy and lbvz arrays.
All associated DL_MESO loop and data structure transformations for padding and AoS->SoA are summarized in Figures 10 and 11 below, with accompanying Intel Advisor Vectorization Efficiency andMemory Access Patterns Report metrics.
DL_MESO engineers told us that while refactoring was relatively time consuming and cannot be considered low hanging (as opposed to padding), the resulting speedup confirmed that it was definitely worth doing: the loop in fGetEquilibrium has gotten another 2x speedup on top of the already optimized version. Similar speedups were observed in several other loops manipulated with the lbv array.
Figure 10. Padding and data layout (AoS -> SoA) transformations impact for loop in fGetEquilibriumF, accompanied by data from the Intel Advisor Survey analysis, Trip Counts analysis and MAP analysis.
Figure 11. Data allocation, loop implementation and Intel Advisor MAP stride data for padding and data layout (AoS -> SoA) transformations for loop in fGetEquilibriumF.
For more such intel Modern Code and tools from Intel, please visit the Intel® Modern Code
Source:https://software.intel.com/en-us/articles/get-a-helping-hand-from-the-vectorization-advisor

