
Air quality monitoring is an interesting topic to explore with the rises in pollution, allergy sensitivity, awareness of health & fitness, and technology innovation. The consumer marketplace has seen innovative products released bringing more awareness to air quality monitoring in the home. One such product is the smart scale. These smart scales monitor a variety of health related parameters and also the air quality. The air quality is sent to the cloud and an app can alert you to the changes in the air quality so you will know when an area needs ventilation with fresh air. Having an awareness of the air quality could allow for an improved quality of life. This article shows a method of exploring air quality monitoring by measuring carbon dioxide, volatile organic compounds (VOC), and dust levels using the Arduino* ecosystem and sending the data to a cloud service provider.
The Intel® Edison platform is a natural fit for starting a new prototype or migrating an existing one given its fast processor, large memory size, and integrated connectivity for WiFi and Bluetooth. The Arduino ecosystem provides a capable set of hardware and firmware libraries to experiment with using the Intel® Edison Compute Module and Intel® Edison Arduino Breakout Board.
To learn more about the Intel Edison platform, please see the link below:
http://www.intel.com/content/www/us/en/do-it-yourself/edison.html
Hardware Components:
This project uses the following hardware components for the air quality monitoring system:
- Intel® Edison Compute Module
- Intel® Edison Arduino Breakout Board
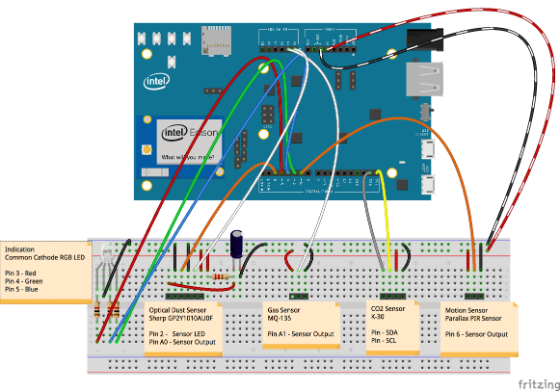
- Common Cathode RGB LED + 3 x 1kΩ resistors
- GP2Y1010AU0F Optical Dust Sensor + 150Ω resistor + 220 µF electrolytic capacitor
- MQ-135 Gas Sensor
- K-30 CO2 Sensor
- PIR Motion Sensor
Theory of Operation:
Figure 1 shows the hardware component connections to the Intel® Edison Arduino Breakout Board. The system uses an RGB LED as a simple visual indication system for displaying the air quality.
To determine the total air quality of an area, three sensors are used:
1. An optical dust sensor is used to measure the dust in the area.
2. A gas sensor is used to measure the Volatile Organic Compounds (VOC) such as smoke.
3. A CO2 sensor is used to measure the carbon dioxide levels with an I2C interface.
In addition, a motion sensor is used for helping the system get the best representation of the total air quality in an area, by filtering out temporary increases in dust concentration caused by movement, and temporary increases in CO2 concentration caused by a person breathing close to the sensors.
When there is no motion detected, the firmware reads the air quality sensors, analyzes the sensor data, updates the visual indication system, and sends the air quality data to the cloud. The details of the system are further discussed in the Firmware section.
To learn more about the sensors, please see the data sheets at the links below:
http://www.kosmodrom.com.ua/pdf/MQ135.pdf
https://www.sparkfun.com/datasheets/Sensors/gp2y1010au_e.pdf
http://www.co2meter.com/collections/co2-sensors/products/k-30-co2-sensor-module
http://www.ladyada.net/media/sensors/PIRSensor-V1.2.pdf
Configuring the I2C Clock Frequency:
It is important to note that at the time of this writing, the default I2C clock frequency on Intel® Edison is above 100kHZ which is outside the specification of the K-30 CO2 sensor. The K-30 CO2 sensor supports a maximum I2C clock frequency (SCL) of 100kHz. The Intel® Edison I2C clock frequency can be changed to 100kHZ following a few steps:
-Ensure that the latest Intel® Edison Yocto firmware image is installed:
http://www.intel.com/support/edison/sb/CS-035180.htm
-Open an Edison Linux terminal and login as root:
https://software.intel.com/en-us/articles/getting-started-with-the-intel-edison-board-on-windows
-cd /sys/devices/pci0000:00/0000:00:09.1/i2c_dw_sysnode
-echo std > mode
-cat mode
To learn more about the Intel® Edison compute module and the I2C peripheral, please see the link below:
http://www.intel.com/support/edison/sb/CS-035274.htm?wapkw=intel+edison+compute+module+hardware+guide
Firmware:
The following code shows the includes, macros, and functions for the air quality system. Functions for Initialization, Main Loop, Reading Motion Sensor, Reading Air Quality Sensors, Analyzing Total Air Quality, Updating Visual Indication LED, and Sending Data to a Cloud Service Provider are discussed.
Includes:
1 #include<Wire. >
Macros:
01 //Pin Defines
02 #define gasSensorPin A1
03 #define dustSensorPin A0
04 #define dustSensorLEDPin 2
05 #define redRGBLEDPin 3
06 #define greenRGBLEDPin 4
07 #define blueRGBLEDPin 5
08 #define motionSensorPin 6
09
10 //Air Quality Defines
11 #define AIR_QUALITY_OPTIMAL 2
12 #define AIR_QUALITY_GOOD 1
13 #define AIR_QUALITY_BAD 0
14 #define AIR_QUALITY_UNKNOWN -1
15 #define MAX_SENSOR_READINGS 10
16 #define SENSOR_READING_DELAY 1000
17
18 //Motion Sensor Defines
19 #define MOTION_NOT_DETECTED 0
20 #define MOTION_DETECTED 1
21 define MOTION_DELAY_TIME 1000
22
23 //Dust Sensor Timing Parameters (from p.5 of datasheet)
24 #define SAMPLE_DELAY 280 //Sampling
25 #define PULSEWIDTH_DELAY 40 //Pw
26 #define PERIOD_DELAY 9680 //T
27
28 //Gas Sensor Thresholds
29 #define GAS_SENSOR_OPTIMAL 140
30 #define GAS_SENSOR_GOOD 200
31
32 //Dust Sensor Thresholds
33 #define DUST_SENSOR_OPTIMAL 125
34 #define DUST_SENSOR_GOOD 250
35
36 //CO2 Sensor Thresholds
37 #define CO2_SENSOR_OPTIMAL 800
38 #define CO2_SENSOR_GOOD 2000
Functions:
Initialization: This function initializes the serial debug interface, the I/O pins, and the I2C interface.
01 void setup() {
02 Serial.begin(9600);
03 pinMode(gasSensorPin, INPUT);
04 pinMode(dustSensorPin, INPUT);
05 pinMode(dustSensorLEDPin, OUTPUT);
06 pinMode(redRGBLEDPin, OUTPUT);
07
pinMode(greenRGBLEDPin, OUTPUT);
08 pinMode(blueRGBLEDPin, OUTPUT);
09 pinMode(motionSensorPin, INPUT);
10 Wire.begin();
11 }
Main Loop: The main loop initializes the system, checks for motion, reads the air quality sensors, analyzes the total air quality, updates the indication LED, and sends the data to a cloud service.
01 void loop() {
02 // — Init
03 int airQuality = 0;
04 int motion = 0;
05 int sensorAirQuality[3] = {0,0,0}; //0-Gas Sensor, 1-CO2 Sensor, 2-DustSensor
06 Serial.println("");
07
08 // — Check for motion
09 motion = readMotionSensor();
10
11 if (motion == MOTION_NOT_DETECTED) {
12 // — Read Air Quality Sensors
13 readAirQualitySensors(sensorAirQuality);
14
15 // — Analyze Total Air Quality
16 airQuality = analyzeTotalAirQuality(sensorAirQuality[0],sensorAirQuality[1],sensorAirQuality[2]);
17
18 // — Update Indication LED
19 updateIndicationLED(airQuality);
20
21 // — Update Air Quality Value for Cloud Datastream
22 updateCloudDatastreamValue(CHANNEL_AIR_QUALITY_ID, airQuality);
23
24 // — Send Data To Cloud Service
25 sendToCloudService();
26 }
27 }
Reading Motion Sensor: The motion sensor is read by sampling the sensor’s digital output pin. If motion is detected, the sensor output pin will go HIGH. The function attempts to filter glitches and returns whether motion was detected or not.
01 int readMotionSensor() {
02 // — Init
03 int motionSensorValue = MOTION_NOT_DETECTED;
04 int motion = MOTION_NOT_DETECTED;
05
06 Serial.println("-Read Motion Sensor");
07
08 // — Read Sensor
09 motionSensorValue = digitalRead(motionSensorPin);
10
11 // — Analyze Value
12 if (motionSensorValue == MOTION_DETECTED) {
13 delay(MOTION_DELAY_TIME);
14 motionSensorValue = digitalRead(motionSensorPin);
15
16 if (motionSensorValue == MOTION_DETECTED) {
17 motion = MOTION_DETECTED;
18 Serial.println("–Motion Detected");
19 updateIndicationLED(AIR_QUALITY_UNKNOWN);
20 }
21 }
22 return mo
23}
Reading Air Quality Sensors: This function calls the individual gas, co2, and dust sensor functions. The function takes a pointer to integer array for storing the air quality results for each sensor.
1 void readAirQualitySensors(int* sensorAirQuality)
2 {
3 Serial.println("-Read Air Quality Sensors");
4
5 sensorAirQuality[0] = readGasSensor();
6 sensorAirQuality[1] = readCO2Sensor();
7 sensorAirQuality[2] = readDustSensor();
8 }
Reading Gas Sensor: The gas sensor can detect gases such as NH3, NOx, alcohol, Benzene, and smoke. The gas sensor contains an analog voltage output that is proportional to the gas levels in the air. An A/D conversion is performed to read this sensor. The function reads the sensor, averages the readings, analyzes the sensor data, and returns the air quality for this sensor.
01 int readGasSensor() {
02 // — Init
03 int airQuality = 0;
04 int gasSensorValue = 0;
05
06 // — Read Sensor
07 for (int i=0; i < MAX_SENSOR_READINGS; i++) {
08 gasSensorValue += analogRead(gasSensorPin);
09 delay(SENSOR_READING_DELAY);
10 }
11 gasSensorValue /= MAX_SENSOR_READINGS; //Average the sensor readings
12
13 // — Update Cloud Datastream
14 Serial.print("–gasSensorValue = ");
15 Serial.println(gasSensorValue);
16 updateCloudDatastreamValue(CHANNEL_GAS_SENSOR_ID, gasSensorValue);
17
18 // — Analyze Value
19 if (gasSensorValue < GAS_SENSOR_OPTIMAL) {
20 airQuality = AIR_QUALITY_OPTIMAL;
21 }
22 else if (gasSensorValue < GAS_SENSOR_GOOD) {
23 airQuality = AIR_QUALITY_GOOD;
24 }
25 else {
26 airQuality = AIR_QUALITY_BAD;
27 }
28
29 return airQuality;
30 }
Reading Dust Sensor: The dust sensor contains an optical sensing system that is energized using a digital output pin. An A/D conversion is then performed to sample the sensor’s analog voltage output that is proportional to the dust in the air. This function reads the sensor, averages the readings, analyzes the sensor data, and returns the air quality for this sensor.
01 int readDustSensor() {
02 // — Init
03 int airQuality = 0;
04 int dustSensorValue = 0;
05
06
07 // — Read Sensor
08 for (int i=0; i < MAX_SENSOR_READINGS; i++) {
09 digitalWrite(dustSensorLEDPin,LOW); //Enable LED
10 delayMicroseconds(SAMPLE_DELAY);
11 dustSensorValue += analogRead(dustSensorPin);
12 delayMicroseconds(PULSEWIDTH_DELAY);
13 digitalWrite(dustSensorLEDPin,HIGH); //Disable LED
14 delayMicroseconds(PERIOD_DELAY);
15 delay(SENSOR_READING_DELAY);
16 }
17 dustSensorValue /= MAX_SENSOR_READINGS; //Average the sensor readings
18
19 // — Update Cloud Datastream
20 Serial.print("–dustSensorValue = ");
21 Serial.println(dustSensorValue);
22 updateCloudDatastreamValue(CHANNEL_DUST_SENSOR_ID, dustSensorValue);
23
24 // — Analyze Value
25 if (dustSensorValue < DUST_SENSOR_OPTIMAL) {
26 airQuality = AIR_QUALITY_OPTIMAL;
27 }
28 else if (dustSensorValue < DUST_SENSOR_GOOD) {
29 airQuality = AIR_QUALITY_GOOD;
30 }
31 else {
32 airQuality = AIR_QUALITY_BAD;
33 }
34
35 return airQuality;
36 }
Reading CO2 Sensor: The CO2 sensor returns a CO2 concentration level in parts per million (ppm). The CO2 sensor is read through the I2C interface. This function reads the sensor, averages the readings, analyzes the sensor data, and returns the air quality for this sensor.
01 int readCO2Sensor() {
02 // — Init
03 int airQuality = 0;
04 int co2SensorValue = 0;
05 int tempValue=0;
06 int invalidCount=0;
07
08 // — Read Sensor
09 for (int i=0; i < MAX_SENSOR_READINGS; i++) {
10 tempValue = readCO2(); // see http://cdn.shopify.com/s/files/1/0019/5952/files/Senseair-Arduino.pdf?1264294173 for this function
11 (tempValue == 0) ? invalidCount++ : co2SensorValue += tempValue;
12 delay(SENSOR_READING_DELAY);
13 }
14
15 if (invalidCount != MAX_SENSOR_READINGS) {
16 co2SensorValue /= (MAX_SENSOR_READINGS – invalidCount); //Average the sensor readings
17 }
18
19 // — Update Cloud Datastream
20 Serial.print("–co2SensorValue = ");
21 Serial.println(co2SensorValue);
22 updateCloudDatastreamValue(CHANNEL_CO2_SENSOR_ID, co2SensorValue);
23
24 // — Analyze Value
25 if (co2SensorValue < CO2_SENSOR_OPTIMAL) {
26 airQuality = AIR_QUALITY_OPTIMAL;
27 }
28 else if (co2SensorValue < CO2_SENSOR_GOOD) {
29 airQuality = AIR_QUALITY_GOOD;
30 }
31 else {
32 airQuality = AIR_QUALITY_BAD;
33 }
34
35 return airQuality;
36 }
Analyzing Total Air Quality: This function determines the total air quality for the area by analyzing the gas, co2, and dust air quality values passed to this function. The function returns the total air quality level for the area.
01 int analyzeTotalAirQuality(int gasAirQuality, int co2AirQuality, int dustAirQuality) {
02 int airQuality = 0;
03 Serial.println("-Analyze Total Air Quality");
04 if (gasAirQuality==AIR_QUALITY_BAD \
05 || dustAirQuality==AIR_QUALITY_BAD \
06 || co2AirQuality==AIR_QUALITY_BAD) {
07 Serial.println("–Air Quality Is BAD");
08 airQuality = AIR_QUALITY_BAD;
09 }
10 else if (gasAirQuality == AIR_QUALITY_OPTIMAL \
11 && dustAirQuality == AIR_QUALITY_OPTIMAL \
12 && co2AirQuality==AIR_QUALITY_OPTIMAL) {
13 Serial.println("–Air Quality Is OPTIMAL");
14 airQuality = AIR_QUALITY_OPTIMAL;
15 }
16 else {
17 Serial.println("–Air Quality Is Good");
18 airQuality = AIR_QUALITY_GOOD;
19 }
20 return airQuality;
21 }
Updating Visual Indication LED: This function updates the indication LED to the appropriate color for the air quality value that is passed to this function. The LED turns blue for optimal air quality levels, green for good air quality levels, and red for bad air quality levels. The LED turns magenta if motion is detected.
01 void updateIndicationLED(int airQuality) {
02 Serial.println("-Update Indication LED");
03 // –Turn off all colors
04 digitalWrite(redRGBLEDPin,LOW);
05 digitalWrite(greenRGBLEDPin,LOW);
06 digitalWrite(blueRGBLEDPin,LOW);
07
08 // –Update Indication LED
09 if (airQuality == AIR_QUALITY_UNKNOWN) {
10 digitalWrite(redRGBLEDPin,HIGH);
11 digitalWrite(greenRGBLEDPin,HIGH);
12 digitalWrite(blueRGBLEDPin,HIGH);
13 }
14 else if (airQuality == AIR_QUALITY_OPTIMAL) {
15 digitalWrite(blueRGBLEDPin, HIGH);
16 }
17 else if (airQuality == AIR_QUALITY_GOOD) {
18 digitalWrite(greenRGBLEDPin, HIGH);
19 }
20 else {
21 digitalWrite(redRGBLEDPin, HIGH);
22 }
23 }
Sending Data to a Cloud Service Provider:
To connect Intel® Edison to a WiFi network, please see the link below:
http://www.intel.com/support/edison/sb/CS-035342.htm

In this example, xively.com is used as the cloud service provider that the air quality data is sent to. Figure 2 shows an example feed with four channels. The channels are further discussed in the Functions section. Integration with xively.com requires the Http Client and Xively libraries added to the Arduino IDE. Please see the link below to learn more about xively.com, creating an account, Arduino tutorials, and library integration with the Arduino IDE.
https://xively.com/dev/tutorials/arduino_wi-fi/
The following code shows an example of the includes, macros, and functions that can be added to the air quality system to add xively.com support.
Includes:
1 #include <WiFi.h>
2 #include <HttpClient.h>
3 #include <Xively.h>
Macros:
01 //Xively.com Defines
02 #define XIVELY_FEED <enter your feed number here>
03 #define XIVELY_KEY <enter your key string here>
04 #define XIVELY_HTTP_SUCCESS 200
05 #define CHANNEL_AIR_QUALITY "AIR_QUALITY"
06 #define CHANNEL_AIR_QUALITY_ID 0
07 #define CHANNEL_GAS_SENSOR "GAS_SENSOR"
08 #define CHANNEL_GAS_SENSOR_ID 1
09 #define CHANNEL_CO2_SENSOR "CO2_SENSOR"
10 #define CHANNEL_CO2_SENSOR_ID 2
11 #define CHANNEL_DUST_SENSOR "DUST_SENSOR"
12 #define CHANNEL_DUST_SENSOR_ID 3
13 #define MAX_CHANNELS 4
Global Variables:
01 //Xively Datastream
02 XivelyDatastream datastreams[] = {
03 XivelyDatastream(CHANNEL_AIR_QUALITY, strlen(CHANNEL_AIR_QUALITY), DATASTREAM_FLOAT),
04 XivelyDatastream(CHANNEL_GAS_SENSOR, strlen(CHANNEL_GAS_SENSOR), DATASTREAM_FLOAT),
05 XivelyDatastream(CHANNEL_CO2_SENSOR, strlen(CHANNEL_CO2_SENSOR), DATASTREAM_FLOAT),
06 XivelyDatastream(CHANNEL_DUST_SENSOR, strlen(CHANNEL_DUST_SENSOR), DATASTREAM_FLOAT)
07 };
08
09 //Xively Feed
10 XivelyFeed feed(XIVELY_FEED, datastreams, MAX_CHANNELS);
11
12 //Xively Client
13 WiFiClient client;
14 XivelyClient xivelyclient(client);
Functions:
Updating the data stream: This function is called to update the values for a xively.com channel datastream. The function is passed the channelID, and the datastream value. In this system as shown in Figure 2, four datastreams are used. The datastreams are updated with raw sensor data from the gas, co2, and dust sensor functions. In addition, a datastream is also updated in the main loop with the total air quality value.
1 void updateCloudDatastreamValue(int channelID, int value) {
2 // — Update the Datastream Value
3 datastreams[channelID].setFloat(value);
4 }
Sending the Datastreams to Xively: This function performs a PUT operation to a xively.com feed. The function returns the status of successful or the error code. The main loop calls this function.
01 void sendToCloudService() {
02 int status=0;
03 Serial.println("-Send To Cloud Service”);
04
05 // — Upload the Datastream to Xively
06 status = xivelyclient.put(feed, XIVELY_KEY);
07
08 // — Verify Transaction
09 if (status == XIVELY_HTTP_SUCCESS) {
10 Serial.println("–HTTP OK");
11 }
12 else {
13 Serial.print("–ERROR: ");
14 Serial.println(status);
15 }
16 }
Summary:
Hope you enjoyed exploring air quality monitoring with the Intel Edison platform. Challenge yourself to add additional indication showing the status of each sensor, to add enhancements to the cloud service experience with alert triggers when the air quality changes, and also look for opportunities to integrate air quality monitoring with other systems.
For more such intel IoT resources and tools from Intel, please visit the Intel® Developer Zone
Source: https://software.intel.com/en-us/articles/exploring-air-quality-monitoring-using-intel-edison/


