CPU-Bound Offline Analysis with Intel Graphics Performance Analyzers (GPA) – Platform Analyzer
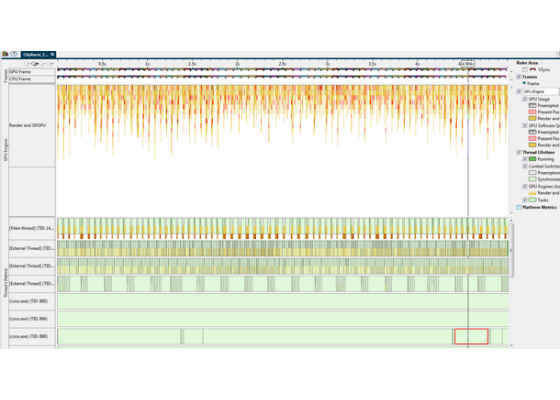
Intel® Graphics Performance Analyzers (Intel® GPA) Platform Analyzer visualizes the execution profile of the tasks in your code on the entire platform over time, on both the CPU and GPU. This helps you understand task-based issues within your game, enabling you to optimize the compute and rendering tasks across both the CPU and GPU. Intel GPA Platform Analyzer uses trace data collected during the application run to provide a detailed analysis of how your code executes across all threads and correlates the CPU workload with that on the GPU.
Previously, we shared how to do an analysis using the Intel GPA Frame Analyzer for DirectX*. In this article we are going to do a walkthrough of how to do CPU-bound offline analysis of the workflow.
Analyzing a trace capture using the Intel® Graphics Performance Analyzers Platform Analyzer
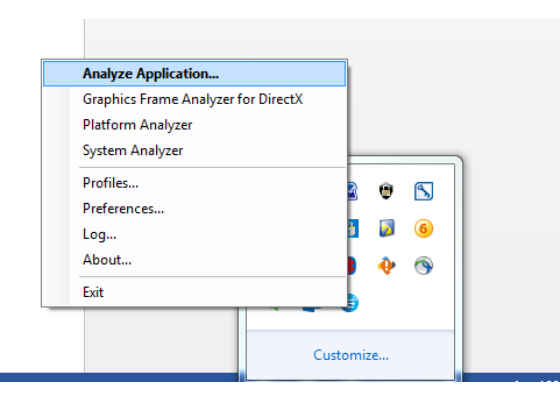
Click Analyze Application as shown below. This feature allows you to browse the binary to the game that we want to analyze and run it. The Intel GPA monitor injects the code into the game to extract the profiling data.
1. Analyze application window
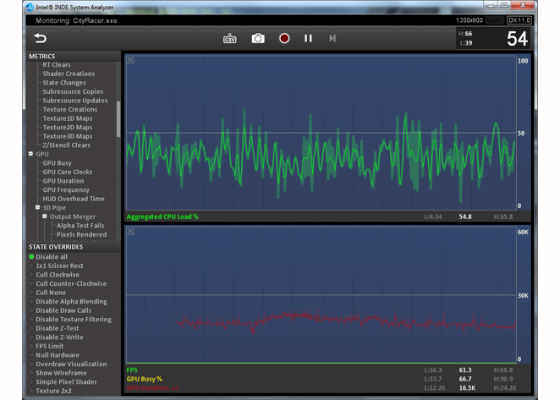
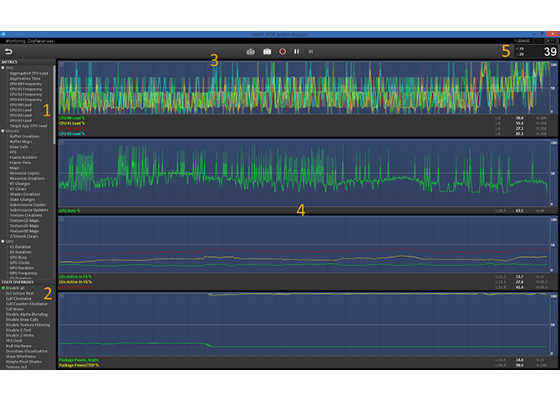
If your application is CPU bound, capture a trace so you can open in Intel GPA Platform Analyzer and do profiling for that application. If the application is GPU bound, capture a frame. If you are using Intel GPA System Analyzer, click the camera button for capturing frames or click the red record button for capturing traces. In you are using HUD shortcut keys, by default Ctrl+Shift+C is the hot key for frames and Ctrl+Shift+T is the hot key for trace capture.
We will do a trace capture to analyze using the Intel GPA Platform Analyzer as shown below.
2. Intel GPA System Analyzer
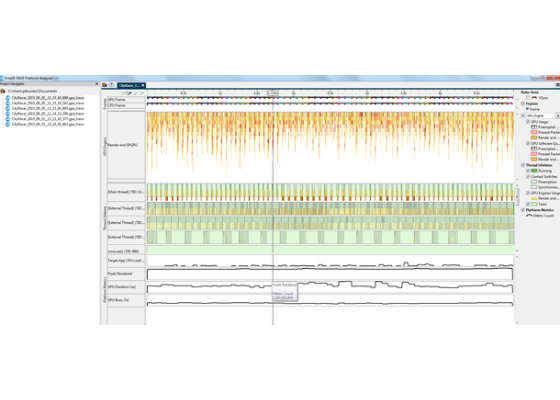
Open the Intel GPA Platform Analyzer. On the left side is a list of traces. Double-click the latest trace captured. Once the trace opens, you will see a few different windows as shown below.
3. Intel GPA Platform Analyzer: opening the trace
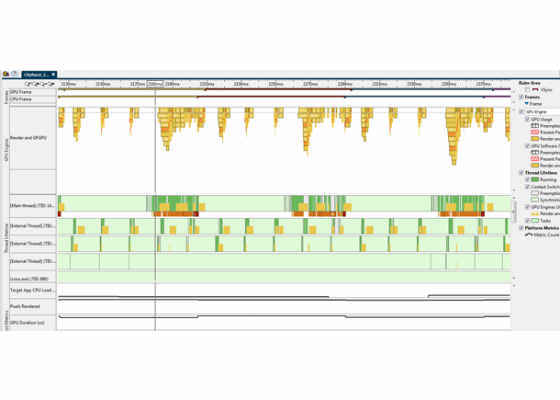
Once the trace loads, the main windows displays the timeline of all the data in relationship to the time.
- At the bottom of the windows you see all the metrics that are enabled and recording while capturing the trace.
- At the center of the screen you see all of the threads that were running at the time of capture.
- At the top you see the GPU frame delimiters and CPU frame delimiters and what tasks were occurring.
Let’s focus on CPU offline analysis. Notice that the duration of the trace is around 5 seconds long. This can be modified in the profiles section of the graphics monitor.
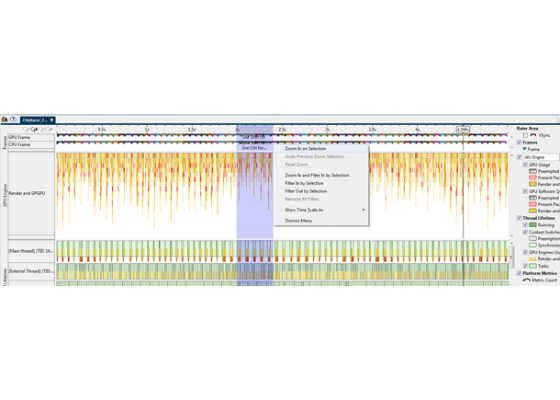
Let’s zoom in to see the smaller section of this trace. Clicking and dragging a section (using the left mouse button and then releasing) zooms into that section. Zoom in to get three frames with the data as shown below.
4. Zooming and selecting the frames
5. Intel GPA Platform Analyzer
Now that we zoomed into the three frames, let’s look at the individual columns.
Frames column
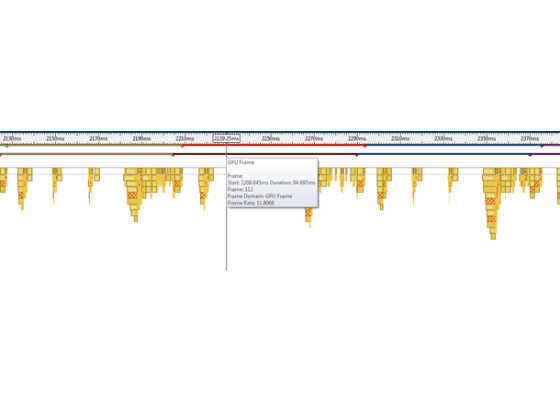
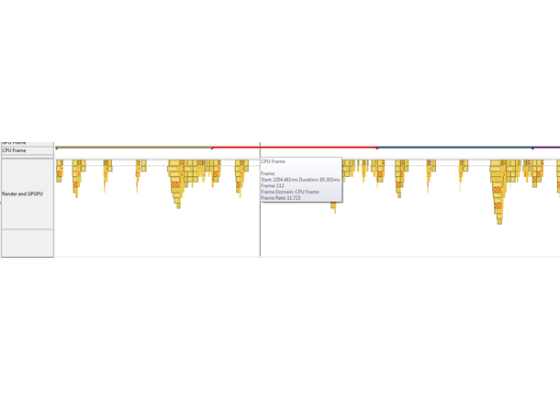
In the frames columns you can view individual GPU and CPU frame timings. Notice that the colors correlate to the same CPU and GPU frames. For example, the CPU 112 frame is the same frame color as the GPU 112 frame.
6. Intel GPA Platform Analyzer: GPU frame
7. Intel GPA Platform Analyzer: CPU frame
We can looks at individual durations and also calculate the difference between when the CPU frame started and when the GPU frame started.
Render and GPGPU column
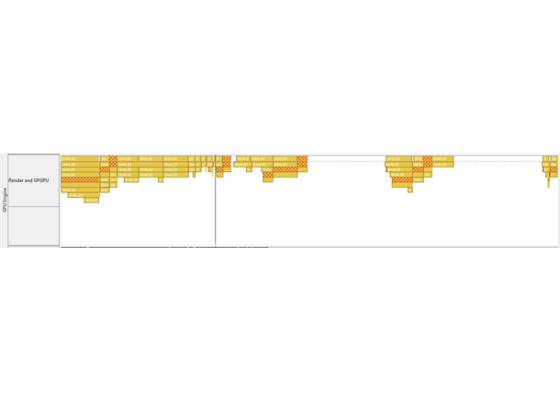
Everything above the dotted line is executing on the GPU. The red cross-hatched areas as shown below are the present calls. You can trace a present call from when it originates to when it is executed. You will see when a present call is executed and when the GPU frame is finished, which helps calculate the single frame latency. You can see when the present call is submitted by the CPU and when it is completed by the GPU.
8. Intel GPA Platform Analyzer: Render and GPGPU column
Threads pane
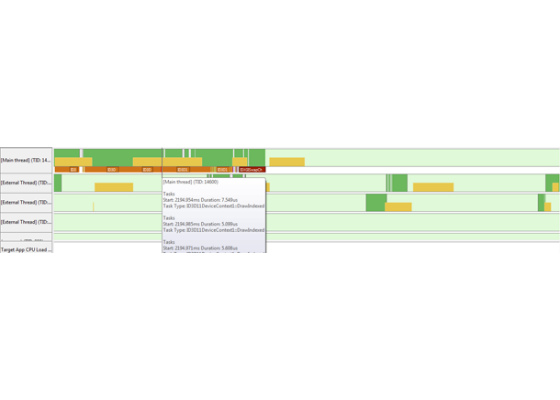
You can view when the thread was running, when the OS needed to switch the context, and when there was synchronization. In addition you can see the GPU work overlayed on the thread, which can help correlate when the GPU or the CPU is busy, identifying whether the workload is CPU bound or GPU bound. You can view each of the DirectX API calls as well as user-defined calls if available.
9. Intel Platform Analyzer: Threads column
Platform Metrics
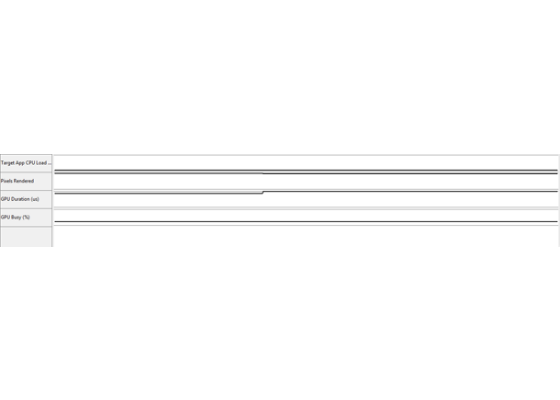
The metrics that display here are the metrics we set up in the HUD profile. If a trace is taken using Intel GPA System Analyzer, the metrics are the ones in the Intel GPA System Analyzer at that time.
10. Intel GPA Platform Analyzer: Platform metrics column
Statistics pane
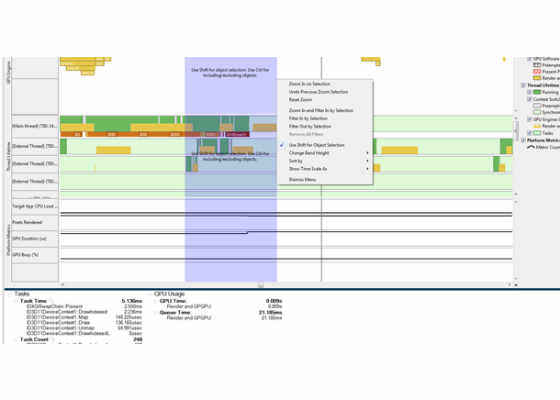
This pane will update, synchronized with your selection. Depending on what you selected, this pane displays GPU usage, OpenCL™ kernels, or tasks such as user-defined functions or DirectX calls. The pane can also identify hotspots in certain areas in the trace. For example, if you highlight a section, the statistics pane changes as shown below. You can see the task time for the selected area, the GPU time, and the GPU queue time.
11. Intel GPA Platform Analyzer: Statistics column
12. Selecting an area and the statistics pane changes
Legend area
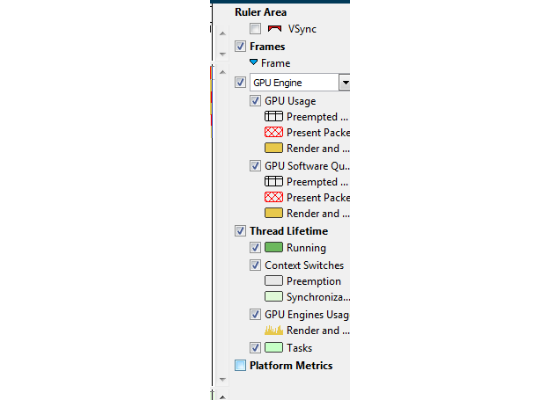
You can turn off some of the sections to make the UI less complicated. You can clear a check box to remove that section.
13. Intel GPA Platform Analyzer: Legend pane
14. Intel GPA Platform Analyzer after unchecking Platform metrics from the legend pane
About the Author
Praveen Kundurthy works in the Intel® Software and Services Group. He has a master’s degree in Computer Engineering. His main interests are mobile technologies, Microsoft Windows*, and game development.
Intel technologies’ features and benefits depend on system configuration and may require enabled hardware, software or service activation.
Performance varies depending on system configuration. Check with your system manufacturer or retailer or learn more at intel.com.
No license (express or implied, by estoppel or otherwise) to any intellectual property rights is granted by this document.
Intel disclaims all express and implied warranties, including without limitation, the implied warranties of merchantability, fitness for a particular purpose, and non-infringement, as well as any warranty arising from course of performance, course of dealing, or usage in trade.
This document contains information on products, services and/or processes in development. All information provided here is subject to change without notice. Contact your Intel representative to obtain the latest forecast, schedule, specifications and roadmaps.
The products and services described may contain defects or errors known as errata which may cause deviations from published specifications. Current characterized errata are available on request.
Copies of documents which have an order number and are referenced in this document may be obtained by calling 1-800-548-4725 or by visiting www.intel.com/design/literature.htm.
Intel and the Intel logo are trademarks of Intel Corporation in the U.S. and/or other countries.
For more such intel resources and tools from Intel on Game, please visit the Intel® Game Developer Zone
Source: https://software.intel.com/en-us/articles/cpu-bound-offline-analysis-with-intel-graphics-performance-analyzers-gpa-platform-analyzer

